Study the following table and answer the questions.
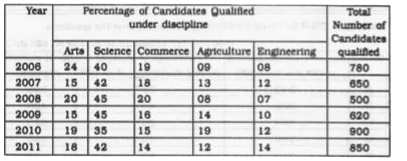
The difference in the average number of candidates qualified in Science discipline per year from 2006 to 2008 and the average number of candidates qualified in the same discipline from 2009 to 2011 was
47
57
74
141
The correct Answer is:A
Step by step video, text & image solution for Study the following table and answer the questions. The difference in the average number of candidates qualified in Science discipline per year from 2006 to 2008 and the average number of candidates qualified in the same discipline from 2009 to 2011 was by Maths experts to help you in doubts & scoring excellent marks in Class 14 exams.
Updated on:21/07/2023Topper's Solved these Questions
- STATISTICS AND DATA INTERPRETATIONBOOK - KIRAN PUBLICATIONCHAPTER - STATISTICS AND DATA INTERPRETATIONEXERCISE - TYPE-II
131 Videos
- STATISTICS AND DATA INTERPRETATIONBOOK - KIRAN PUBLICATIONCHAPTER - STATISTICS AND DATA INTERPRETATIONEXERCISE - TYPE-III
39 Videos
- SIMPLIFICATIONBOOK - KIRAN PUBLICATIONCHAPTER - SIMPLIFICATIONEXERCISE - TEST YOURSELF
25 Videos
- TIME AND DISTANCEBOOK - KIRAN PUBLICATIONCHAPTER - TIME AND DISTANCEEXERCISE - Type -XI
74 Videos
Similar Questions
Knowledge Check
Study the following table and answer the questions.
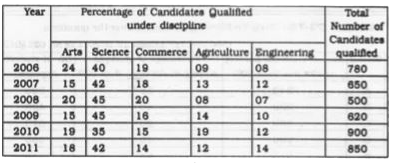
The decrease in the number of candidates qualified under Arts discipline from 2010 to 2011 wasA11B18C42D69Study the following table carefully to answer these questions ---
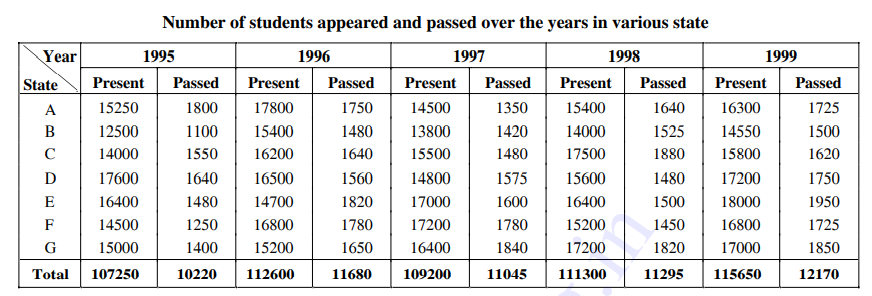
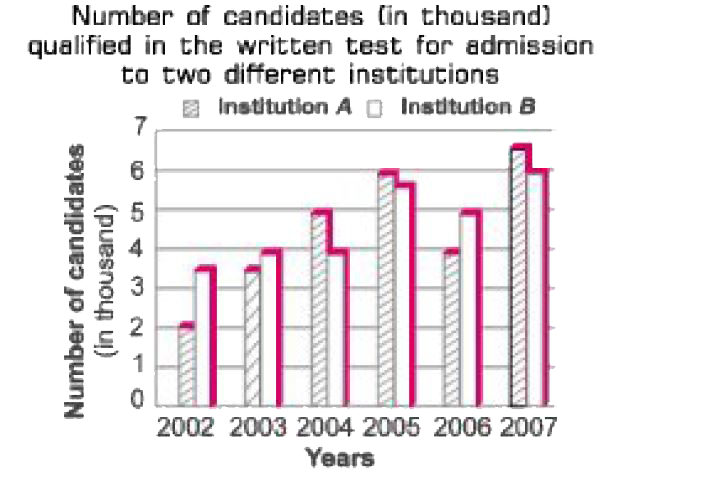
What is the average number of students appeared in B for all years ?A15850B14550C15050DNone of theseWhat is the difference between the total number of candidates qualified in written test in the year 2006 for admission to institution A and B together and the number of candidates qualified in written test in the year 2003 for admission to institution Al
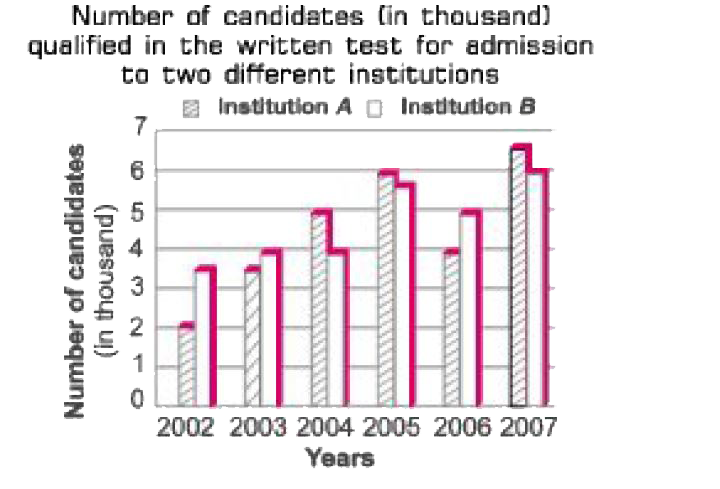 A500B3500C1500D5500
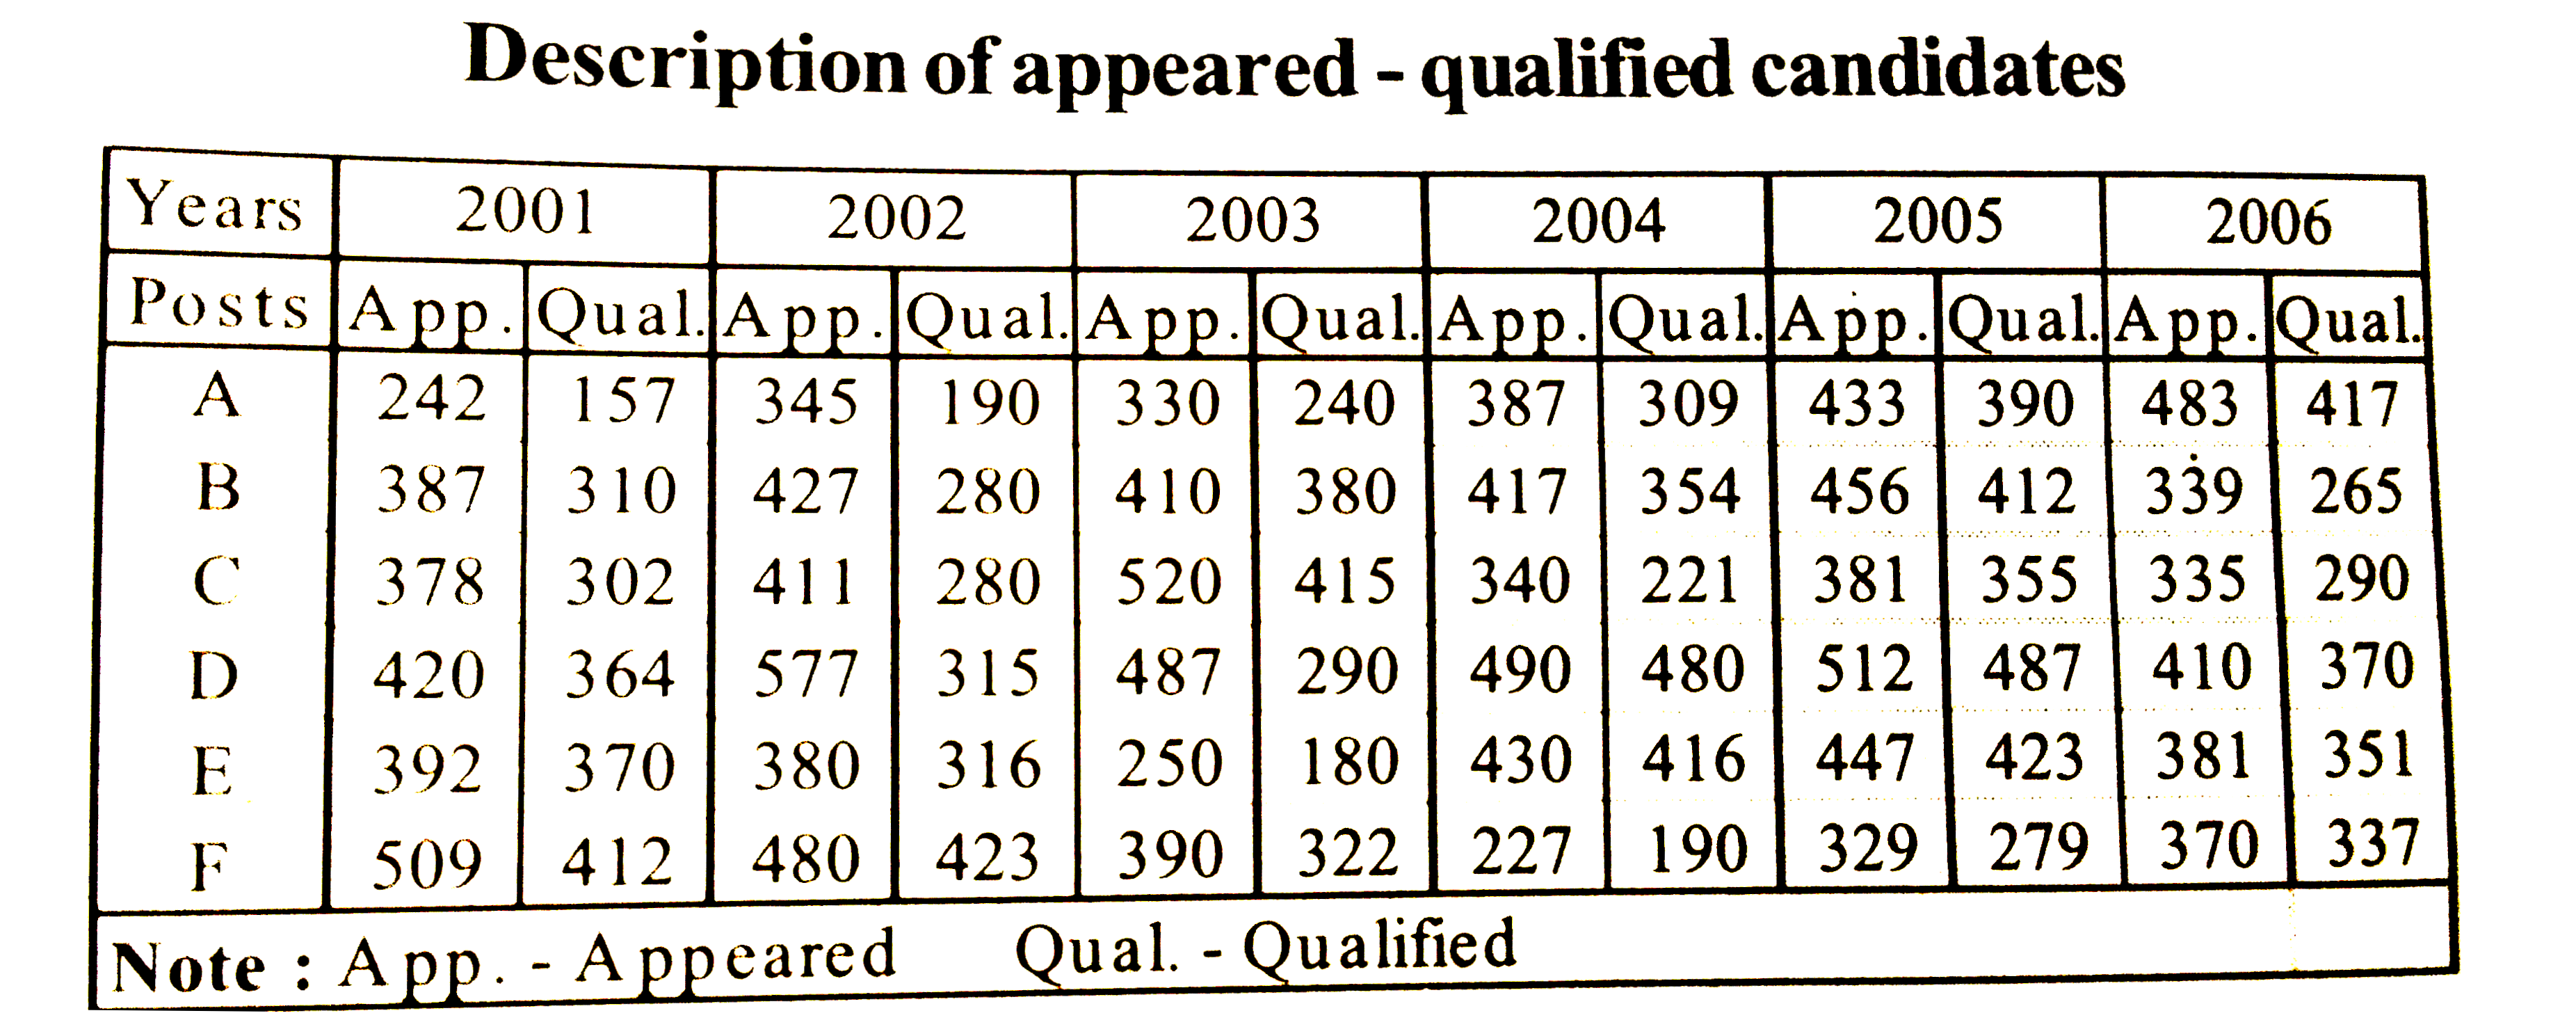
The difference between the number of candidates who appeared and qualified for the post D in the years 2001,2002 and 2003 is
View SolutionStudy the following graph carefully and answer the questions that follow
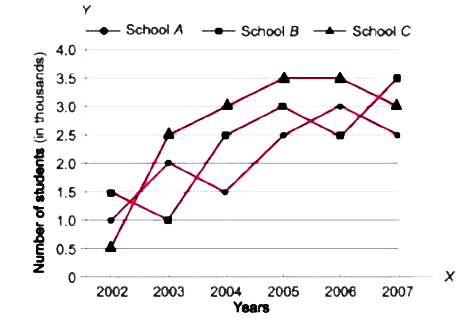
What was the average number of students in all schools together in the year 2006 ?
View SolutionDirection: The following table represents the number of candidates that appeared and qualified in a competitive examination from different states over five years. Study the table and answer the questions that follow.
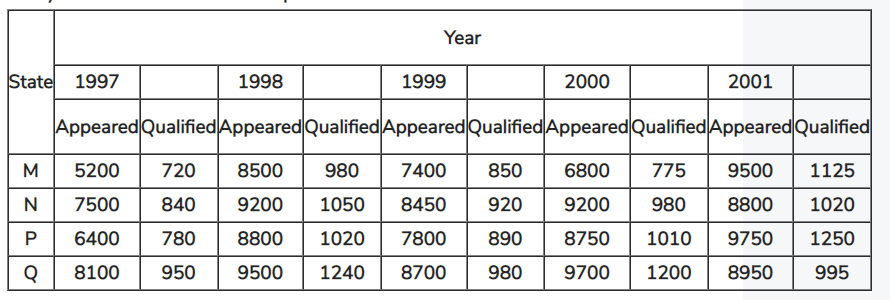
What is the difference between the number of candidates qualifying in the year 1998, in the states M and P?
View SolutionStudy the table carefully to answer the questions that follow-
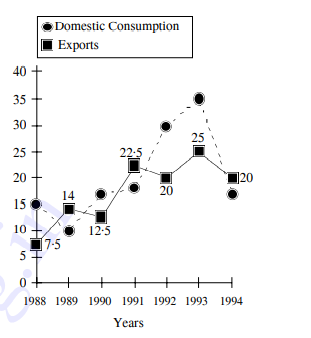
What is the approximate average number of units sold in the year 1999?
View SolutionWhat was the respective ratio between the number of candidates qualified in the written test in the year 2002 for admission in institution B and the number of candidates qualified in the written test in the year 2006 for admission to institution A?
View Solution

