The following Bar chart shows the sales of a company XYZ (in Rs Crore). Study the chart and answer the following questions.
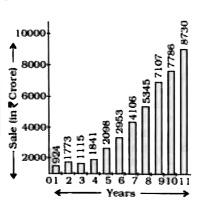
Total sales in 2nd and 3rd years together is :
Rs 2688 crores
Rs 2888 crores
Rs 2788 crores
Rs 2488 crores
The correct Answer is:B
Step by step video & image solution for The following Bar chart shows the sales of a company XYZ (in Rs Crore). Study the chart and answer the following questions. Total sales in 2nd and 3rd years together is : by Maths experts to help you in doubts & scoring excellent marks in Class 14 exams.
Updated on:21/07/2023Topper's Solved these Questions
- STATISTICS AND DATA INTERPRETATIONBOOK - KIRAN PUBLICATIONCHAPTER - STATISTICS AND DATA INTERPRETATIONEXERCISE - TYPE-III
39 Videos
- STATISTICS AND DATA INTERPRETATIONBOOK - KIRAN PUBLICATIONCHAPTER - STATISTICS AND DATA INTERPRETATIONEXERCISE - TYPE-IV
182 Videos
- STATISTICS AND DATA INTERPRETATIONBOOK - KIRAN PUBLICATIONCHAPTER - STATISTICS AND DATA INTERPRETATIONEXERCISE - TYPE-VIII
8 Videos
- SIMPLIFICATIONBOOK - KIRAN PUBLICATIONCHAPTER - SIMPLIFICATIONEXERCISE - TEST YOURSELF
25 Videos
- TIME AND DISTANCEBOOK - KIRAN PUBLICATIONCHAPTER - TIME AND DISTANCEEXERCISE - Type -XI
74 Videos
Similar Questions
The following Bar chart shows the sales of a company XYZ (in Rs Crore). Study the chart and answer the following questions.
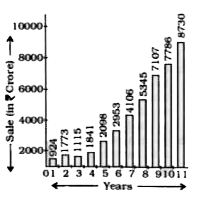
The 2nd highest sale in the year :
View SolutionThe following Bar chart shows the sales of a company XYZ (in Rs Crore). Study the chart and answer the following questions.
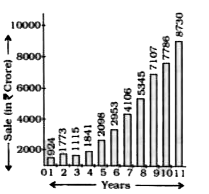
The 2nd least sale is in the year :
View Solution
Knowledge Check
The bar graph shows the annual sales of the different departments of a company. Study the diagram and answer the following questions.
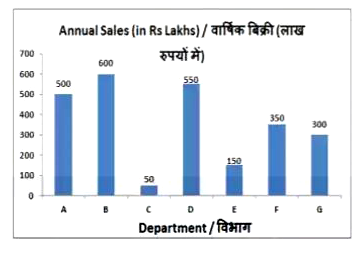
The annual sales of department F is lesser than that of department A by ___________.A150%B30%C75%D42.8%The pie chart shows the break up of expenditure of a trading company for the year 2017. Study the diagram and answer th following questions.
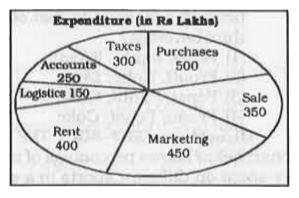
Expenditure on Sales and Marketing constitute what percent of total expenditure?A30%B36%C27.5%D33.33%
The following Bar chart shows the sales of a company XYZ (in Rs Crore). Study the chart and answer the following questions.
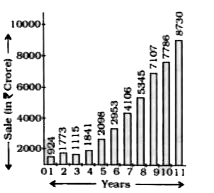
The sale in the year 4 is less than the sale in the year 8, by
View SolutionThe following Bar chart shows the sales of a company XYZ (in Rs Crore). Study the chart and answer the following questions.
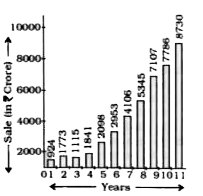
The mean of the highest and the lowest sale (in Rs Crore) is :
View SolutionThe line graph shows the Sales per employee of a certain company. Study the diagram and answer the following questions.
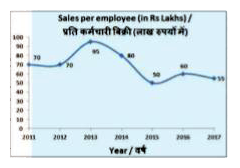
In which year were the Sales per employee greater than that of the previous year?
View SolutionThe line graph shows the Sales per employee of a certain company. Study the diagram and answer the following questions.
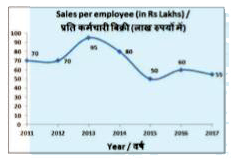
If the number of employees of the company was 80 in the year 2015 then what was the sales (in Rs crore) of the company in the year 2015?
View SolutionThe line graph shows the Sales per employee of a certain company. Study the diagram and answer the following questions.
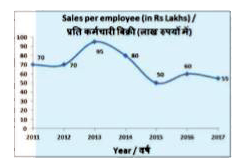
What was the difference in the Sales per employee (in Rs lakhs) between the years 2011 and 2015?
View SolutionThe following graph shows the sales of cars (in thousands) in four cities in 4 years. Study the graph and answer the question
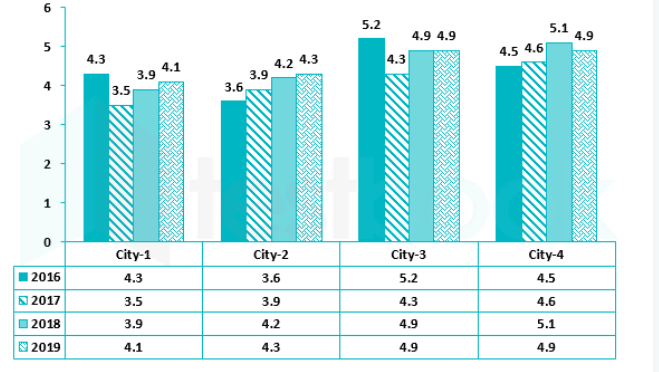
In which year. the sales are highest?
View Solution
