The following table shows the worldwide production of steel in 1920-1927. Study the table and answer the questions.
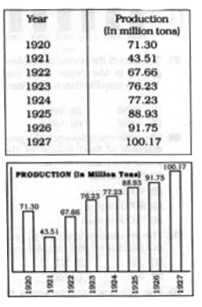
The ratio of production of steel in the year 1924 and 1925 to that of 1923 and 1927 is
The correct Answer is:B
Step by step video & image solution for The following table shows the worldwide production of steel in 1920-1927. Study the table and answer the questions. The ratio of production of steel in the year 1924 and 1925 to that of 1923 and 1927 is by Maths experts to help you in doubts & scoring excellent marks in Class 14 exams.
Updated on:21/07/2023Topper's Solved these Questions
- STATISTICS AND DATA INTERPRETATIONBOOK - KIRAN PUBLICATIONCHAPTER - STATISTICS AND DATA INTERPRETATIONEXERCISE - TYPE-III
39 Videos
- STATISTICS AND DATA INTERPRETATIONBOOK - KIRAN PUBLICATIONCHAPTER - STATISTICS AND DATA INTERPRETATIONEXERCISE - TYPE-IV
182 Videos
- STATISTICS AND DATA INTERPRETATIONBOOK - KIRAN PUBLICATIONCHAPTER - STATISTICS AND DATA INTERPRETATIONEXERCISE - TYPE-VIII
8 Videos
- SIMPLIFICATIONBOOK - KIRAN PUBLICATIONCHAPTER - SIMPLIFICATIONEXERCISE - TEST YOURSELF
25 Videos
- TIME AND DISTANCEBOOK - KIRAN PUBLICATIONCHAPTER - TIME AND DISTANCEEXERCISE - Type -XI
74 Videos
Similar Questions
The following table shows the worldwide production of steel in 1920-1927. Study the table and answer the questions.
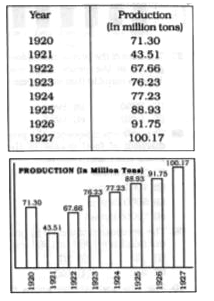
The difference of the production of steel in t he year 1923 and 1924 is x% of 1927. Then the value of x is approximately
View SolutionThe following table shows the worldwide production of steel in 1920-1927. Study the table and answer the questions.
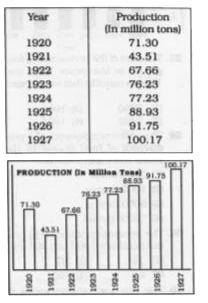
The average production of steel is (in million tonnes)
View Solution
Knowledge Check
In the following table, the production of various crops (in tonnes) is given from 2015 to 2019. Study the table and answer the question that follows:
दी गयी तालिका में, 2015 से 2019 तक विभिन्न फसलों का उत्पादन (टन में ) दिया गया है | इस तालिका का अध्ययन करें तथा फिर पूछे गए प्रश्न का उत्तर दीजिए |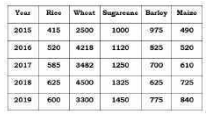 The percentage growth of maize in the year 2019 over the year 2015 is: (correct to one decimal place)
वर्ष 2019 में वर्ष 2015 की तुलना में मक्का के उत्पादन में कितने प्रतिशत की वृद्धि हुई है ? ( दशमलव के एक स्थान तक )A0.7143B0.6512C0.7777D0.6028The graph shows the production of food grains of a country in different years. Study the graph and answer the questions.
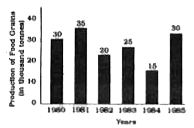
The sum of the production of food grains in the years 1982 and 1984 is equal to that in the year :A1980B1981C1983D1985The line graph shows the production of steel of a certain country. Study the diagram and answer the following questions.
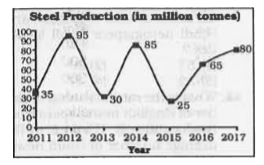
The steel production in 2012 was greater than that in 2015 by _____.A80%B73.6%C200%D280%
The following table shows the worldwide production of steel in 1920-1927. Study the table and answer the questions.
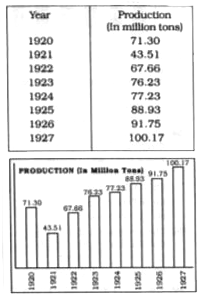
The number of years during which the company has its production less than the average production during 1920-1927 is approximately
View SolutionThe table shows the production of different types of cars (in thousands). Study the table carefully and answer the questions

What is the ratio of the total production of cars ot type A in 2014 and type C in 2013 taken together to the total production of cars of type B in 2016 and type E in 2015 taken together?
View SolutionRefer of the following table. Read the table and answer the questions.
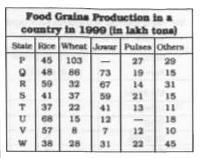
What was the proportion of rice production to wheat production in the country ?
View SolutionRefer of the following table. Read the table and answer the questions.
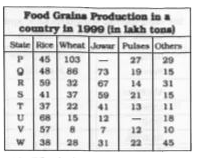
Which State has the highest grain production ?
View SolutionThe line graph shows the production of steel of a certain country. Study the diagram and answer the following questions.
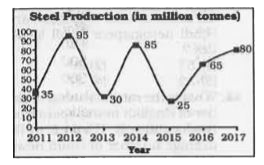
In which year was the steel production lesser than that of the previous year?
View Solution
