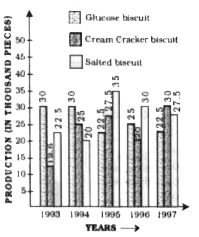
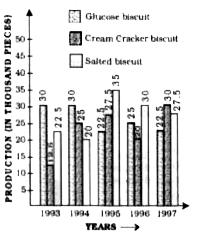
The bar diagram given below shows the productions (in the unit of thousand pieces) of three types of biscuits by a company in the five consecutive years. Study the diagram and answer the following questions.
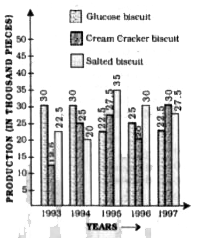
The difference (in the unit of thousand pieces) between the total number of cream cracker biscuits manufactured in the years 1993, 1995 and 1997 and hte total number of the biscuits of same type in the years 1994 and 1996 is
15
25
30
20
The correct Answer is:B
Step by step video, text & image solution for The bar diagram given below shows the productions (in the unit of thousand pieces) of three types of biscuits by a company in the five consecutive years. Study the diagram and answer the following questions. The difference (in the unit of thousand pieces) between the total number of cream cracker biscuits manufactured in the years 1993, 1995 and 1997 and hte total number of the biscuits of same type in the years 1994 and 1996 is by Maths experts to help you in doubts & scoring excellent marks in Class 14 exams.
Topper's Solved these Questions
- BOOK - KIRAN PUBLICATIONCHAPTER - STATISTICS AND DATA INTERPRETATIONEXERCISE - TYPE-V38videos
STATISTICS AND DATA INTERPRETATION
- BOOK - KIRAN PUBLICATIONCHAPTER - STATISTICS AND DATA INTERPRETATIONEXERCISE - TYPE-VI86videos
STATISTICS AND DATA INTERPRETATION
- BOOK - KIRAN PUBLICATIONCHAPTER - STATISTICS AND DATA INTERPRETATIONEXERCISE - TYPE-III39videos
STATISTICS AND DATA INTERPRETATION
- BOOK - KIRAN PUBLICATIONCHAPTER - SIMPLIFICATIONEXERCISE - TEST YOURSELF25videos
SIMPLIFICATION
- BOOK - KIRAN PUBLICATIONCHAPTER - TIME AND DISTANCEEXERCISE - Type -XI74videos
TIME AND DISTANCE
Similar Questions
The bar diagram given below shows the productions (in the unit of thousand pieces) of three types of biscuits by a company in the five consecutive years. Study the diagram and answer the following questions.
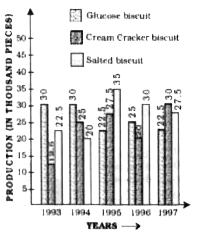
The ratio of production of glucose biscuits and total production of biscuits in that year was maximum inView SolutionStudy the following bar-diagram and answer the questions.
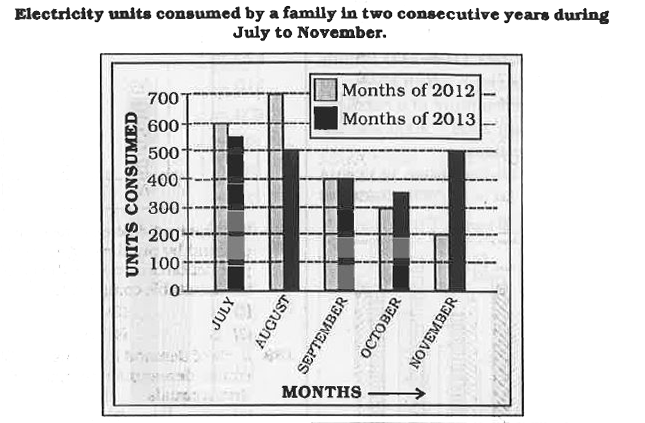
The maximum difference in the units consumption between these to years has been found in the month ofView Solution
Knowledge Check
- Question 1 - Select One
The bar diagram given below shows the productions (in the unit of thousand pieces) of three types of biscuits by a company in the five consecutive years. Study the diagram and answer the following questions.
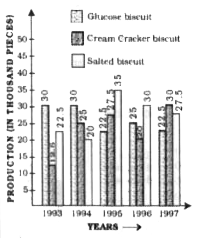
The production of all the three types of biscuits was maximum in the yearA1995B1994C1996D1993 - Question 2 - Select One
The bar diagram given below shows the productions (in the unit of thousand pieces) of three types of biscuits by a company in the five consecutive years. Study the diagram and answer the following questions.
The percentage drop in the number of glucose biscuits manufactured from 1994 t 1995 isA10%B15%C25%D20% - Question 3 - Select One
The bar diagram given below shows the productions (in the unit of thousand pieces) of three types of biscuits by a company in the five consecutive years. Study the diagram and answer the following questions.
Total production of all the three types of biscuits was the least in the yearA1993B1997C1996D1995
Study the bar diagram and answer the questions.
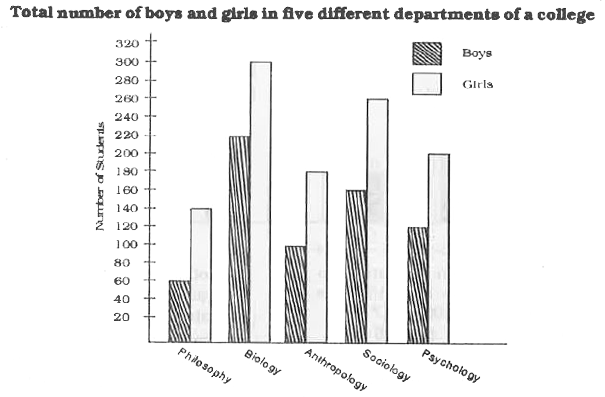
The difference between the total number of bys and the total number of girls from all the Departments together isView SolutionThe pie chart shows the breakup of expenditure of a mining company for the year 2017. Study the diagram and answer the following questions.
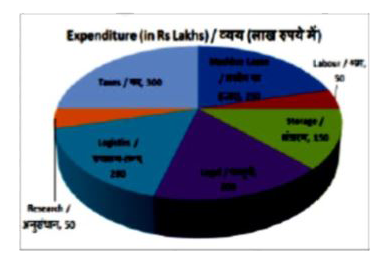
What is the total expenditure (in Rs lakhs)?View SolutionThe pie chart shows the breakup of expenditure of a software company for the year 2017. Study the diagram and answer the following questions.
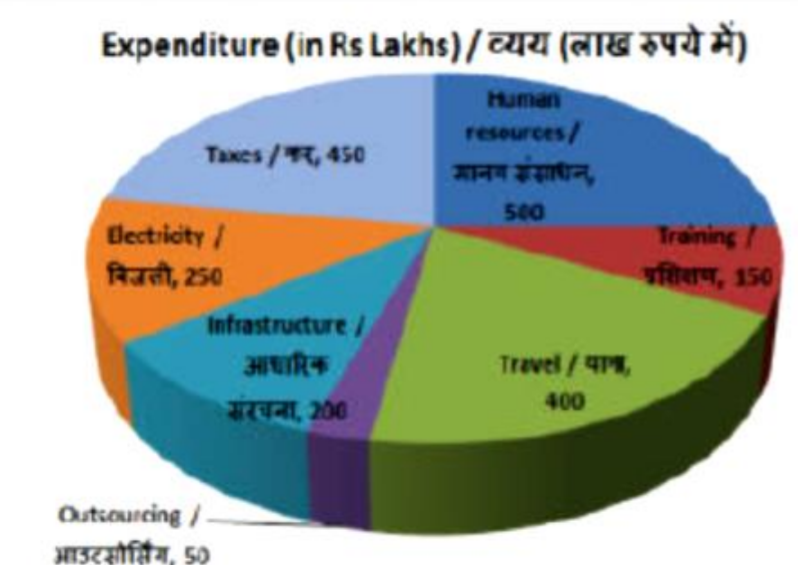
What is the total expenditure (in Rs lakhs)?View SolutionThe pie chart shows the breakup of expendoture of a software company for the year 2017. Study the diagram and answer the following questions.
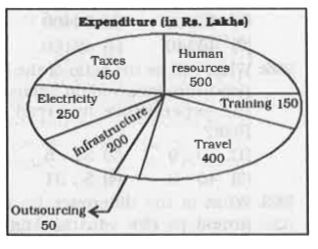
What is the total expenditure (in Rs. lakhs)?View SolutionThe pie chart shows the breakup of expenditure of a manufacturing company for the year 2017. Study the diagram and answer the following questions.
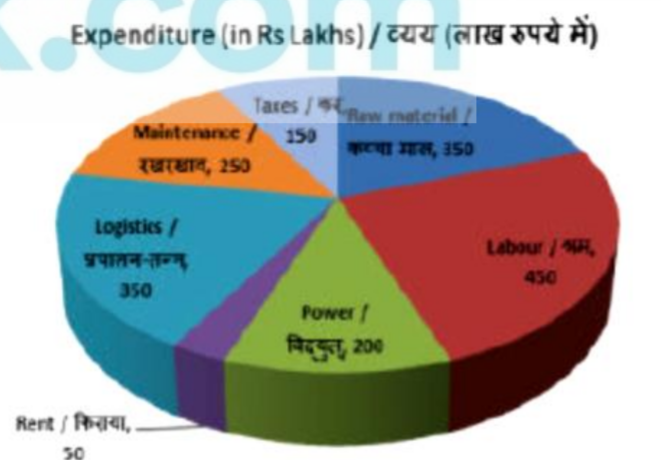
What is the total expenditure (in Rs lakhs)?View Solution

