Study the bar diagram and answer the questions.
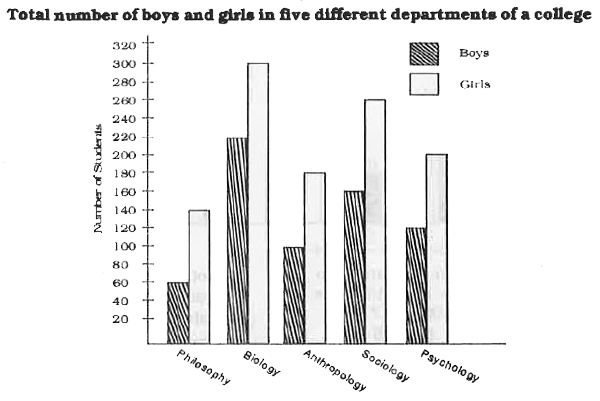
The respective ratio of number of girls from Philosophy Department to the number of girls from Psychology Department is
7:11
11:7
7:10
6:11
The correct Answer is:A
Step by step video, text & image solution for Study the bar diagram and answer the questions. The respective ratio of number of girls from Philosophy Department to the number of girls from Psychology Department is by Maths experts to help you in doubts & scoring excellent marks in Class 14 exams.
Topper's Solved these Questions
- BOOK - KIRAN PUBLICATIONCHAPTER - STATISTICS AND DATA INTERPRETATIONEXERCISE - TYPE-V38videos
STATISTICS AND DATA INTERPRETATION
- BOOK - KIRAN PUBLICATIONCHAPTER - STATISTICS AND DATA INTERPRETATIONEXERCISE - TYPE-VI86videos
STATISTICS AND DATA INTERPRETATION
- BOOK - KIRAN PUBLICATIONCHAPTER - STATISTICS AND DATA INTERPRETATIONEXERCISE - TYPE-III39videos
STATISTICS AND DATA INTERPRETATION
- BOOK - KIRAN PUBLICATIONCHAPTER - SIMPLIFICATIONEXERCISE - TEST YOURSELF25videos
SIMPLIFICATION
- BOOK - KIRAN PUBLICATIONCHAPTER - TIME AND DISTANCEEXERCISE - Type -XI74videos
TIME AND DISTANCE
Similar Questions
Study the following bar graph and answer the questions given below.
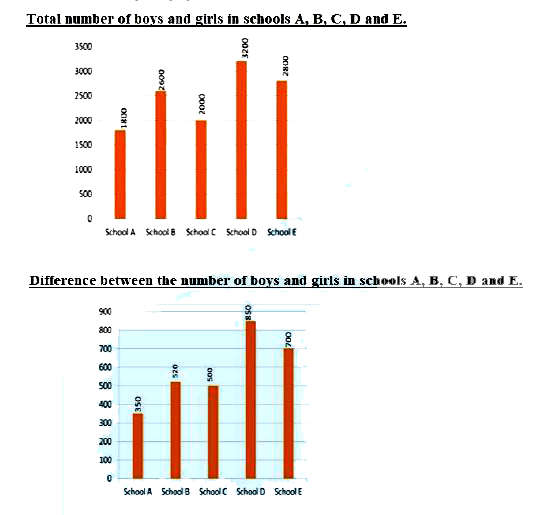
What is the ratio of numbers of boys to the number of girls in school E?View SolutionStudy the following bar graph and answer the questions given below
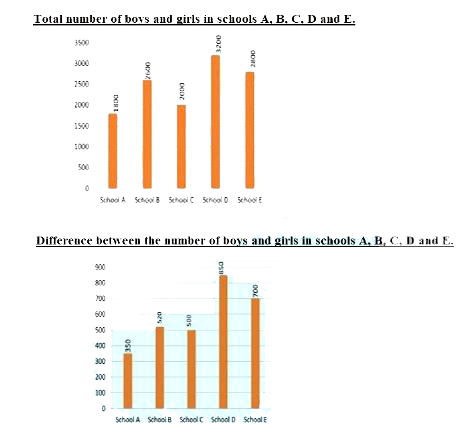
What is the difference the number of girls in school A and the number of girls in school C?View Solution
Knowledge Check
- Question 1 - Select One
Study the bar diagram and answer the questions.
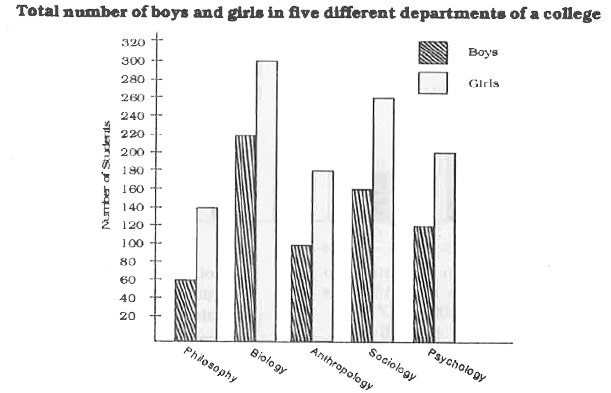
The percentage of the girls from Biology Department compared to the total number of girls from all the other Departments together isA3712B37C3612D3512 - Question 2 - Select One
Study the bar diagram and answer the questions.
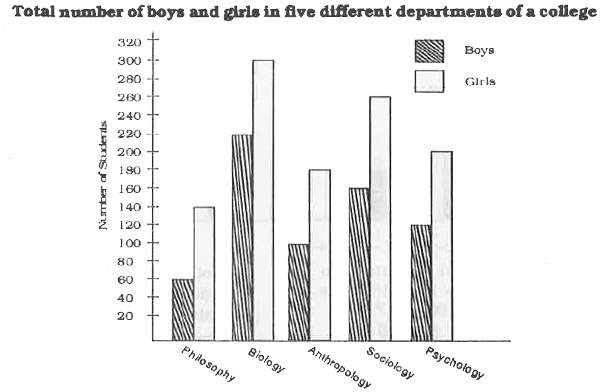
The percentage of the boys from Biology Department compared to the total number of boys from all the other Departments together isA3312B50C3313D30 - Question 3 - Select One
Study the bar diagram and answer the questions.
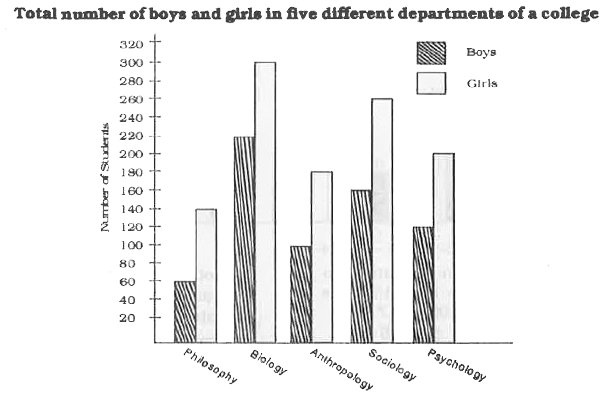
The average number of boys from all the departments together isA123B132C134D142
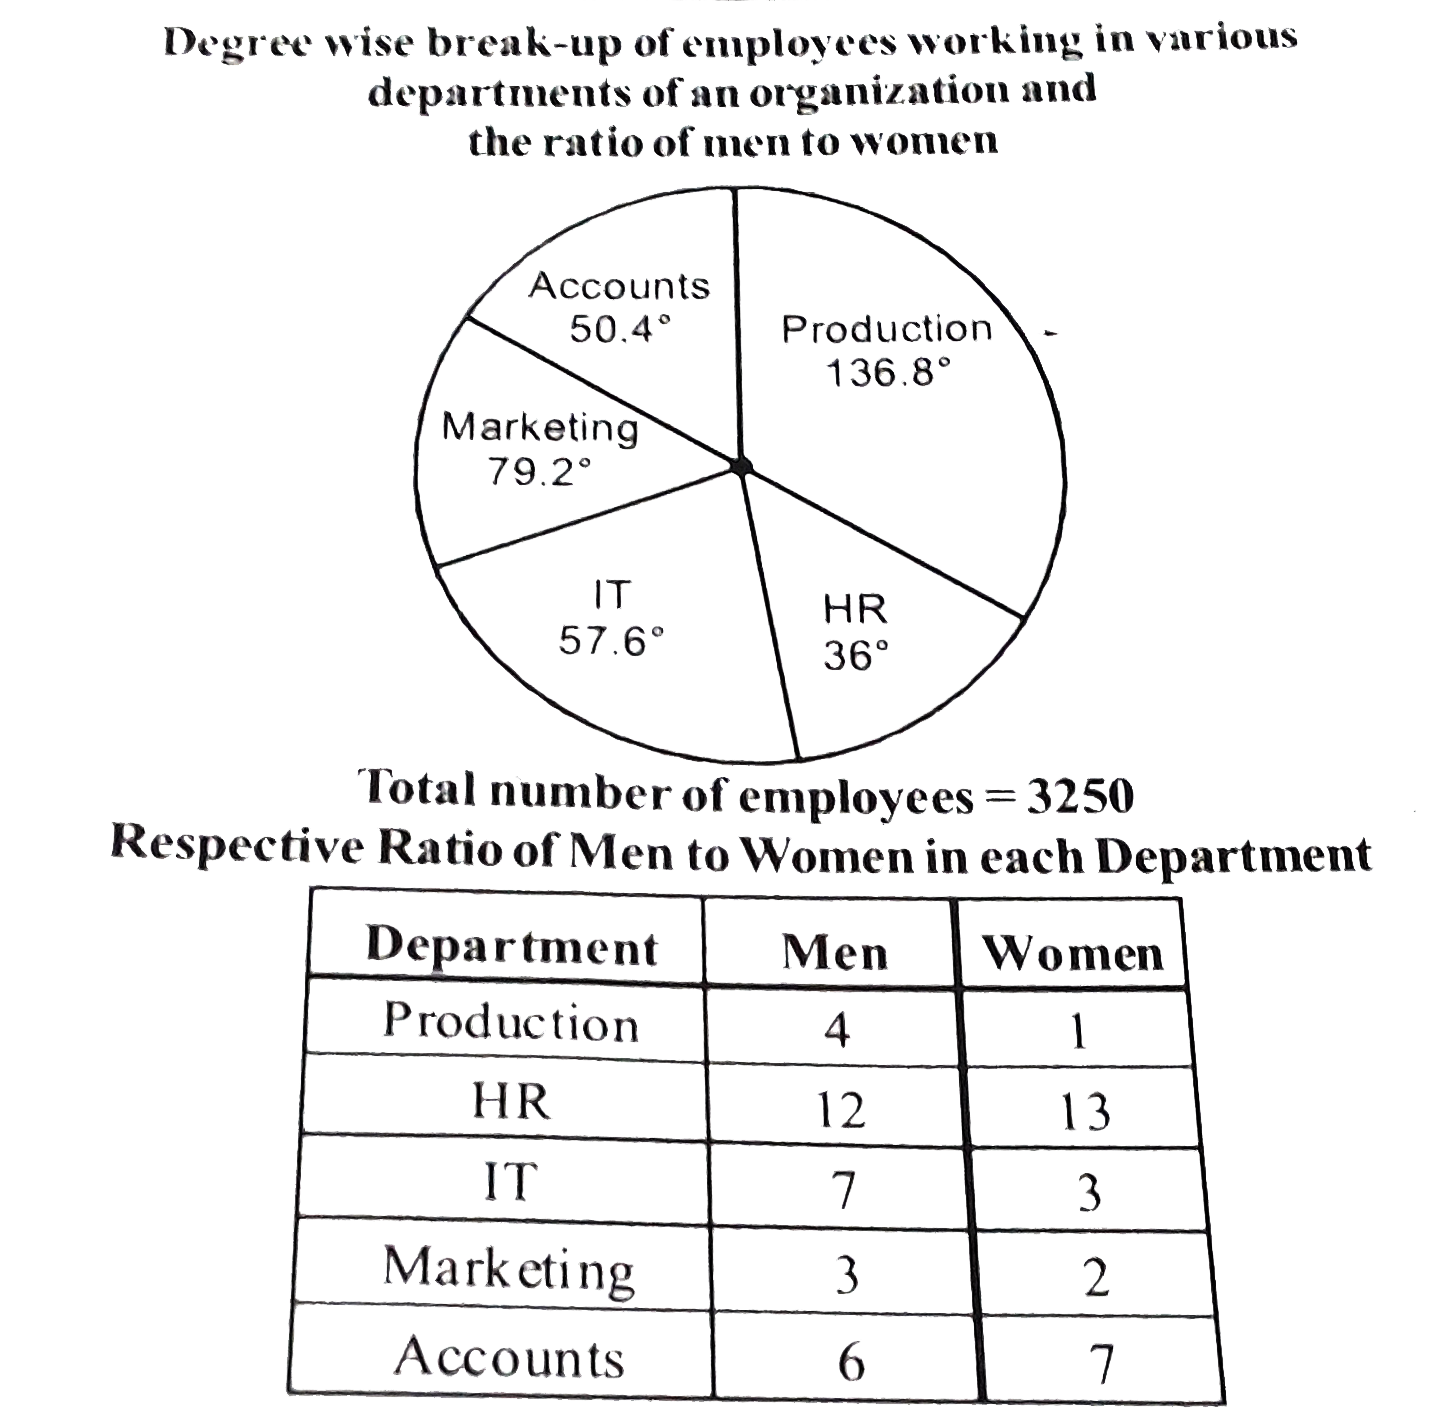
What is the respective ratio of the number of women working in the HR deparments of the number of men working in the IT department ?View SolutionStudy the bar diagram and answer the questions.
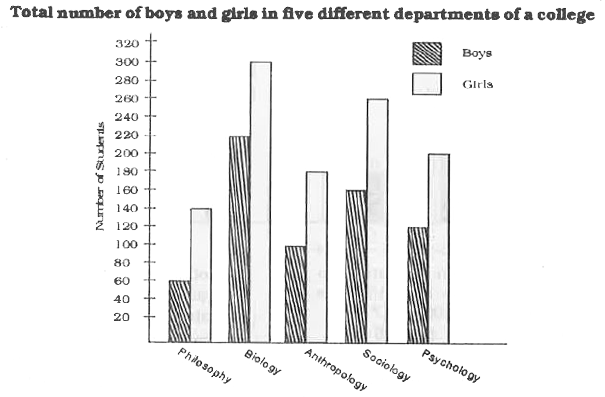
The difference between the total number of bys and the total number of girls from all the Departments together isView SolutionStudy the table and answer the questions.
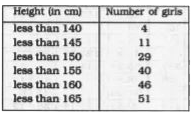
The number of girls whose height is above 150 cm isView SolutionThe bar graph shows the number of employees working in the different departments of a company. Study the diagram and answer the following questions.
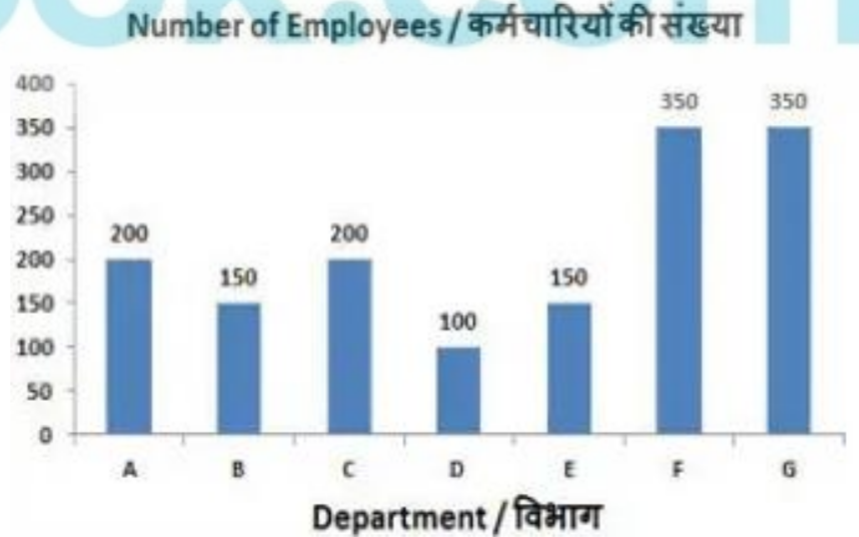
What is the ratio of number of employees of department A to that of department F?View SolutionStudy the given graph and answer the questopm the follows
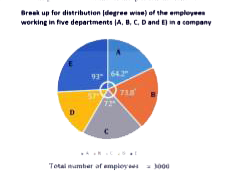
The number of employees in department B is what per cent of the total number of employees woking departments D and E ?View Solution
