Study the following bar-diagram and answer the questions.
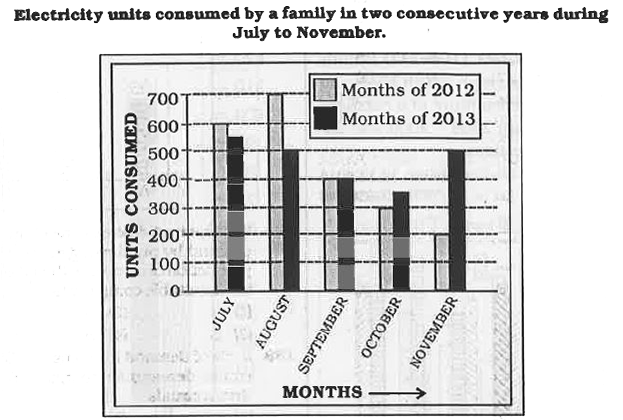
In how many months in 2012, the consumption of electric units was more than the average units consumption in that year ?
4
5
2
3
The correct Answer is:C
Step by step video, text & image solution for Study the following bar-diagram and answer the questions. In how many months in 2012, the consumption of electric units was more than the average units consumption in that year ? by Maths experts to help you in doubts & scoring excellent marks in Class 14 exams.
Topper's Solved these Questions
- BOOK - KIRAN PUBLICATIONCHAPTER - STATISTICS AND DATA INTERPRETATIONEXERCISE - TYPE-V38videos
STATISTICS AND DATA INTERPRETATION
- BOOK - KIRAN PUBLICATIONCHAPTER - STATISTICS AND DATA INTERPRETATIONEXERCISE - TYPE-VI86videos
STATISTICS AND DATA INTERPRETATION
- BOOK - KIRAN PUBLICATIONCHAPTER - STATISTICS AND DATA INTERPRETATIONEXERCISE - TYPE-III39videos
STATISTICS AND DATA INTERPRETATION
- BOOK - KIRAN PUBLICATIONCHAPTER - SIMPLIFICATIONEXERCISE - TEST YOURSELF25videos
SIMPLIFICATION
- BOOK - KIRAN PUBLICATIONCHAPTER - TIME AND DISTANCEEXERCISE - Type -XI74videos
TIME AND DISTANCE
Similar Questions
Study the following graph and answer the questions given below it.
In how many of the given years was the production of salt more than the average production of the given years?View SolutionStudy the following bar-diagram carefully and answer the questions.
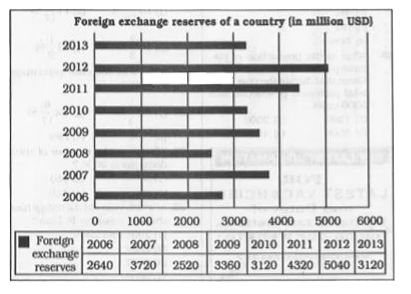
The foreign exchange reserve in 2012 was how many times that in 2009?View Solution
Knowledge Check
- Question 1 - Select One
Study the following graph and answer questions
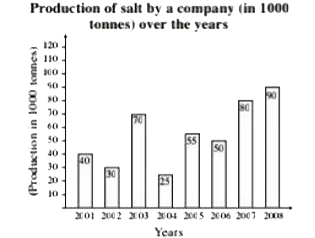
In how many of the given years was the production of salt more than the average production of the given years?A1B2C3D4 - Question 2 - Select One
Study the bar diagram and answer the questions.
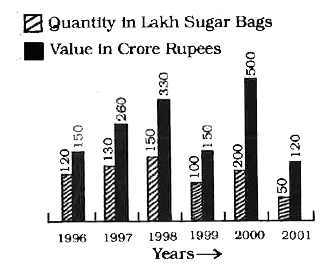
Value per bag was minimum in the yearA2001B1999C1996D1997 - Question 3 - Select One
Study the following bar-diagram and answer the questions.
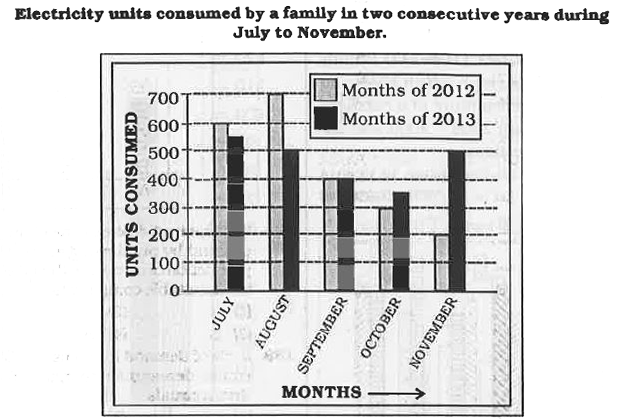
The average electric consumption by the family during these 5 months in 2013 isA460 unitsB400 unitsC440 unitsD450 units
Study the following bar-diagram and answer the questions.
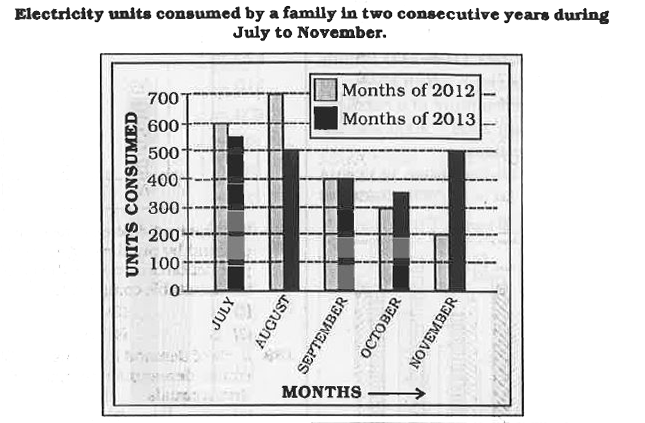
The maximum difference in the units consumption between these to years has been found in the month ofView SolutionStudy the following bar diagram and answer the question that follow.
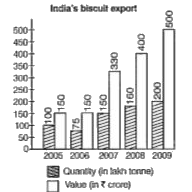
In which year, was the value per tonne minimum?View SolutionStudy the following bar diagram and answer the question that follow.

In which two years, was the value per tonne equal?View Solution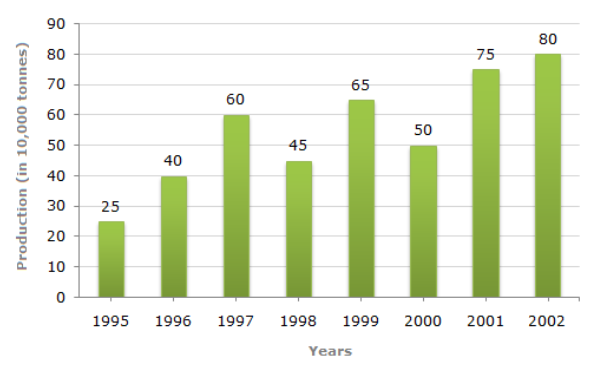
Study the bar chart and answer the question based on it. In how many of the given years was the production of fertilizers less than the average production of the given years?View SolutionStudy the bar graph and answer the question.
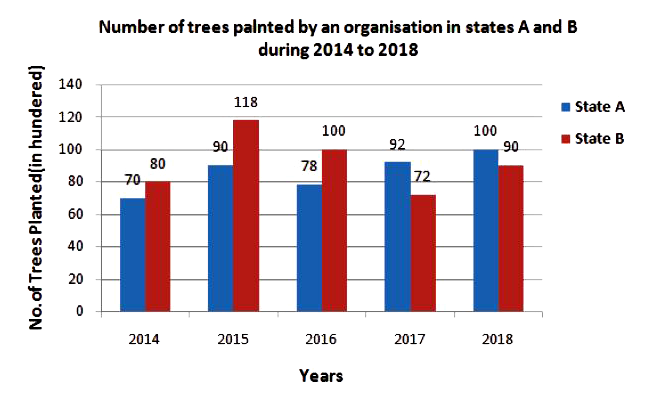
In how many years was the number of trees planted in state B more than the average number of trees planted in state A over the years ?View Solution

