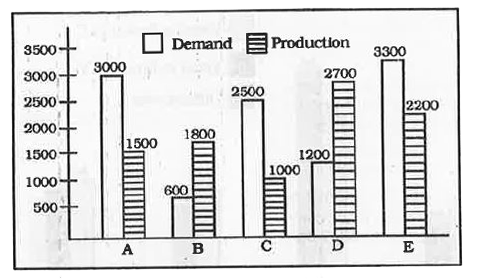
The following chart represents Demand and Production for 5 companies ABCDE. On the basis of the graph answer the questions.
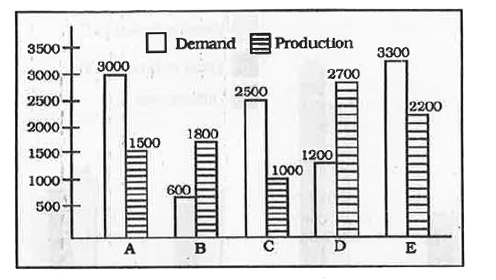
If company A desires to meet the demmand by purchasing surplus production of company, then the most suitable company is :
C
D
E
B
The correct Answer is:B
Step by step video, text & image solution for The following chart represents Demand and Production for 5 companies ABCDE. On the basis of the graph answer the questions. If company A desires to meet the demmand by purchasing surplus production of company, then the most suitable company is : by Maths experts to help you in doubts & scoring excellent marks in Class 14 exams.
Topper's Solved these Questions
- BOOK - KIRAN PUBLICATIONCHAPTER - STATISTICS AND DATA INTERPRETATIONEXERCISE - TYPE-V38videos
STATISTICS AND DATA INTERPRETATION
- BOOK - KIRAN PUBLICATIONCHAPTER - STATISTICS AND DATA INTERPRETATIONEXERCISE - TYPE-VI86videos
STATISTICS AND DATA INTERPRETATION
- BOOK - KIRAN PUBLICATIONCHAPTER - STATISTICS AND DATA INTERPRETATIONEXERCISE - TYPE-III39videos
STATISTICS AND DATA INTERPRETATION
- BOOK - KIRAN PUBLICATIONCHAPTER - SIMPLIFICATIONEXERCISE - TEST YOURSELF25videos
SIMPLIFICATION
- BOOK - KIRAN PUBLICATIONCHAPTER - TIME AND DISTANCEEXERCISE - Type -XI74videos
TIME AND DISTANCE
Similar Questions
The following graph shows the demand and production of cotton by 5 companies A, B, C, D and E. Study the graph and answer question
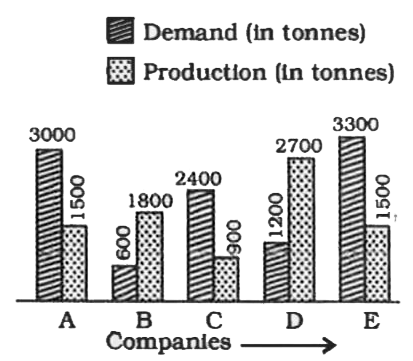
The production of company D is how many times that of the production of the company A?View SolutionThe following graph shows the demand and production of cotton by 5 companies A, B, C, D and E. Study the graph and answer question
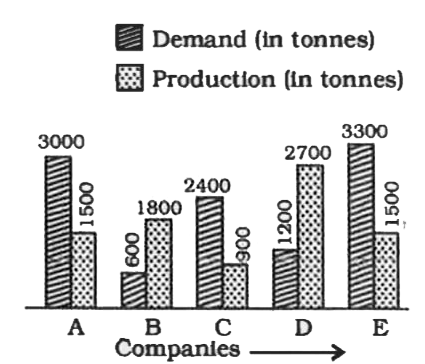
The demand for company B is what percent of the demand for comapny C?View Solution
Knowledge Check
- Question 1 - Select One
The following chart represents Demand and Production for 5 companies ABCDE. On the basis of the graph answer the questions.
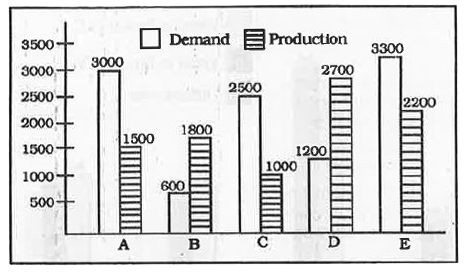
If the production of company D is h times of the production of company A. Then h equals :A1.5B2.5C1.2D1.8 - Question 2 - Select One
The following chart represents Demand and Production for 5 companies ABCDE. On the basis of the graph answer the questions.
If x% of demand for company C equal demand for company B, then x equalsA24B20C60D4 - Question 3 - Select One
The following chart represents Demand and Production for 5 companies ABCDE. On the basis of the graph answer the questions.
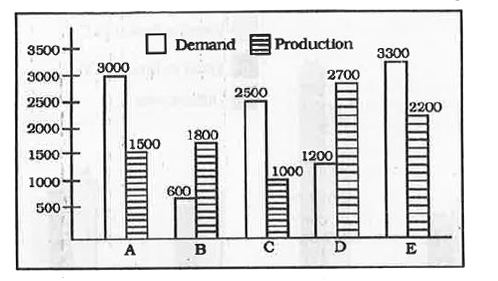
The difference between average demand and average production of the five companies taken together is :A400B280C130D620
The following graph shows the demand and production of cotton by 5 companies A, B, C, D and E. Study the graph and answer question
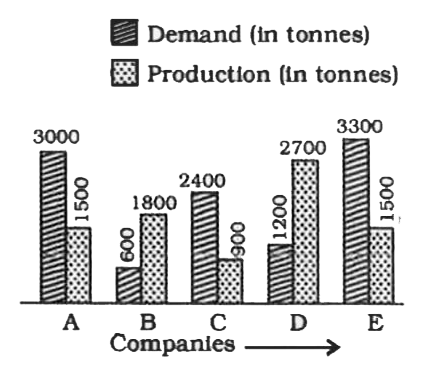
What is the ratio of companies having more demand than production to those having more production than demand?View SolutionThe following graph shows the demand and production of cotton by 5 companies A, B, C, D and E. Study the graph and answer question
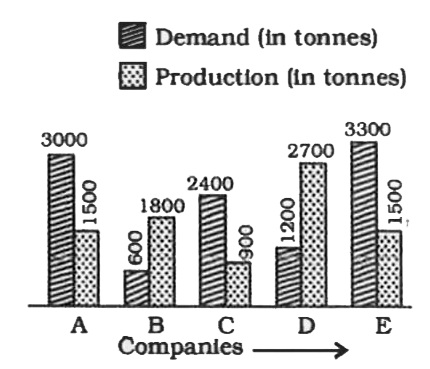
What is the difference in tones) between average demand and average production of the five companies taken together?View SolutionThe following graph shows the production of wheat flour (in 1000 tonnes) by three companies X, Y and Z over the years. Study the graph and answer the questions.
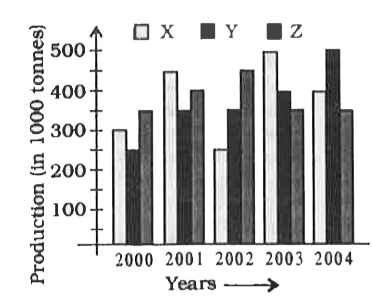
What is the difference between the production of company Z in 2004 and company Y in 2000 (in thousand tonnes)?View SolutionStudy the following graph carefully and answer the questions -----
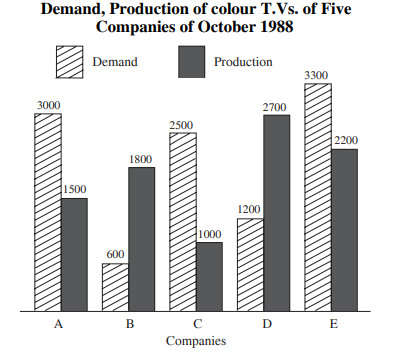
If company 'A' desire to meet the demand by purchasing surplus T.V. sets from a single company, which one of the following companies can meet the need adequately ?View SolutionBoost' is a product of which company?
View Solution

