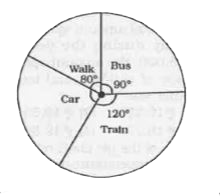
The pie-chart given below represents the number of students using different transport to a school in which total number of students is 2160.
Answer the questions based on the following diagram.
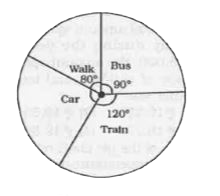
The number of students coming to school by bus exceeds the number of students coming to school walking by
10%
12.5%
11%
11.5%
Step by step video & image solution for The pie-chart given below represents the number of students using different transport to a school in which total number of students is 2160. Answer the questions based on the following diagram. The number of students coming to school by bus exceeds the number of students coming to school walking by by Maths experts to help you in doubts & scoring excellent marks in Class 14 exams.
Updated on:21/07/2023Topper's Solved these Questions
- STATISTICS AND DATA INTERPRETATIONBOOK - KIRAN PUBLICATIONCHAPTER - STATISTICS AND DATA INTERPRETATIONEXERCISE - TYPE-VIII
8 Videos
- STATISTICS AND DATA INTERPRETATIONBOOK - KIRAN PUBLICATIONCHAPTER - STATISTICS AND DATA INTERPRETATIONEXERCISE - TYPE-VI
86 Videos
- SIMPLIFICATIONBOOK - KIRAN PUBLICATIONCHAPTER - SIMPLIFICATIONEXERCISE - TEST YOURSELF
25 Videos
- TIME AND DISTANCEBOOK - KIRAN PUBLICATIONCHAPTER - TIME AND DISTANCEEXERCISE - Type -XI
74 Videos
Similar Questions
The pie chart given below shows the number of students in 6 different sections. The total number of students is 1800.
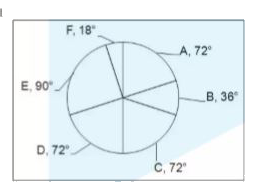
What is the total number of students in section E, C and F?
View SolutionThe pie chart given below shows the number of students in 6 different sections. The total number of students is 1800.
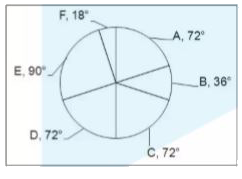
What is the difference between the number of students in section F to the number of students in section C?
View Solution
Knowledge Check
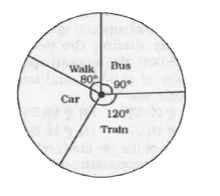
The pie-chart given below represents the number of students using different transport to a school in which total number of students is 2160.
Answer the questions based on the following diagram.
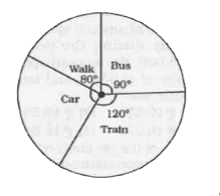
The number of students who come to school by car isA70B290C420D480The pie-chart given below represents the number of students using different transport to a school in which total number of students is 2160.
Answer the questions based on the following diagram.
The number of students who don’t come to school by train isA720B1020C2040D1440The pie-chart given below represents the number of students using different transport to a school in which total number of students is 2160.
Answer the questions based on the following diagram.
The ratio of the number of students who come to school by car to the number of students who come to school by bus isA21:24B21:27C36:27D36:21
The pie chart given below shows the number of students in 6 different sections. The total number of students is 1800.
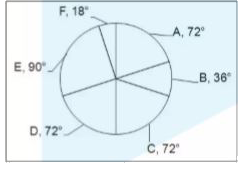
What is the ratio of number of students in section D to the number of students in section F and B?
View SolutionStudy the given pie chart and answer the question that follows
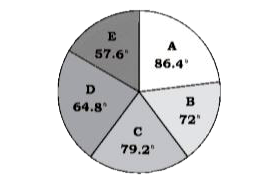
If the total number of students in schools D and E exceeds the number of students in school by x, then x lies between
View SolutionStudy the given graph the question that follows
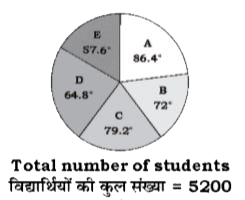
The number of students is school C is what percentage more than the number of students in school B?
View SolutionThe pie-chart given below represents the number of students using different transport to a school in which total number of students is 2160.
Answer the questions based on the following diagram.
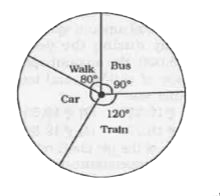
The total number of students coming to school either by walking or by bus is
View SolutionStudy the given pie chart and ansewr the question that follows .
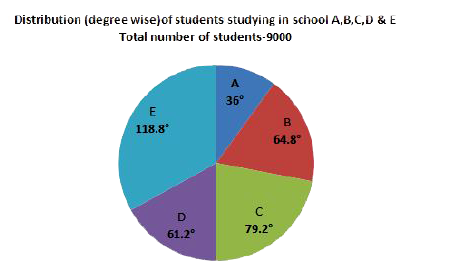
The number of students in school E exceeds the total number of students in schools A and B by x, where x lies between :
View Solution
