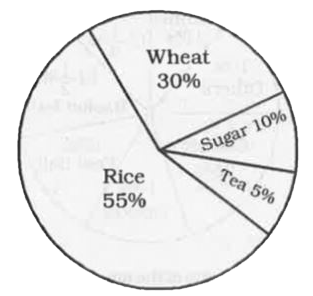
The annual agricultural production (in tonnes) of an Indian State is given in the pie chart. The total production is 9000 tonnes. Read the pie chart and answer the question.
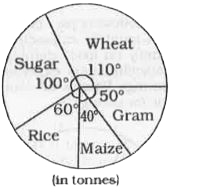
What is the annual production of wheat?
2750 tonnes
3000 tonnes
3540 tonnes
3500 tonnes
The correct Answer is:A
Step by step video, text & image solution for The annual agricultural production (in tonnes) of an Indian State is given in the pie chart. The total production is 9000 tonnes. Read the pie chart and answer the question. What is the annual production of wheat? by Maths experts to help you in doubts & scoring excellent marks in Class 14 exams.
Updated on:21/07/2023Topper's Solved these Questions
- STATISTICS AND DATA INTERPRETATIONBOOK - KIRAN PUBLICATIONCHAPTER - STATISTICS AND DATA INTERPRETATIONEXERCISE - TYPE-VIII
8 Videos
- STATISTICS AND DATA INTERPRETATIONBOOK - KIRAN PUBLICATIONCHAPTER - STATISTICS AND DATA INTERPRETATIONEXERCISE - TYPE-VI
86 Videos
- SIMPLIFICATIONBOOK - KIRAN PUBLICATIONCHAPTER - SIMPLIFICATIONEXERCISE - TEST YOURSELF
25 Videos
- TIME AND DISTANCEBOOK - KIRAN PUBLICATIONCHAPTER - TIME AND DISTANCEEXERCISE - Type -XI
74 Videos
Similar Questions
Knowledge Check
In the following table, the production of various crops (in tonnes) is given from 2015 to 2019. Study the table and answer the question that follows:
दी गयी तालिका में, 2015 से 2019 तक विभिन्न फसलों का उत्पादन (टन में ) दिया गया है | इस तालिका का अध्ययन करें तथा फिर पूछे गए प्रश्न का उत्तर दीजिए |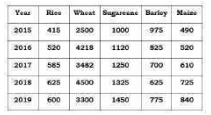 The average production of wheat (in tonnes) in the period given in the table is:
तालिका में दी गयी अवधि में गेहूँ का औसत उत्पादन ( टन में ) कितना रहा है ?A3600B3482C3300D4218The pie chart shows the value of the total annual production of dry fruits of a country. Study the diagram and answer the following questions.
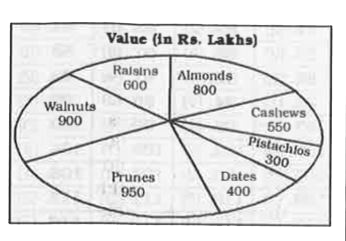
The value of annual production of which dry fruit item is the most?AWalnutsBRalsinsCPrunesDAlmondsThe pie chart shows the value of the total annual production of dry fruits of a country. Study the diagram and answer the following questions.The value of annual production of which dry fruit item is the least ?
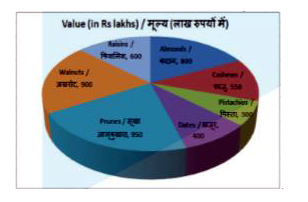
AWalnutsBRaisinsCPistachioDAlmonds
The pie chart shows the value of the total annual agricultural production of a country. Study the diagram and answer the following questions.
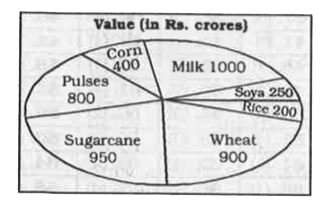
The value of annual production of which agricultural item is the most?
View SolutionThe income of a state under different heads is given in the following pie-chart. Study the chart and answer the questions.

The central angle of the sector representing income tax is :
View SolutionThe pie chart shows the value of the total annual agricultural production of a country. Study the diagram and answer the following questions.
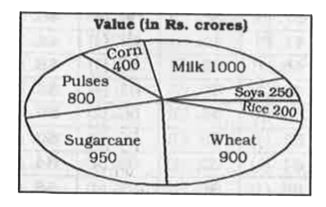
What is the total value (in Rs. crores) of the annual agricultural production of the country?
View SolutionThe pie chart shows the value of the total annual agricultural production of a country. Study the diagram and answer the following questions.

The value of annual production of which agricultural item is the most?
View SolutionIn the given pie-chart, the comaprative study of the production or Rice, Wheat, Sugar and Tea of a country is given. Study the pie-chart and answer the following questions.
The production of rice and tea is more / greater than production of wheat by
View Solution
