The pie chart given below represents the modes of transport for 1400 officers of the Staff Selection Commision, Kolkata. Study the chart and answer the following questions.
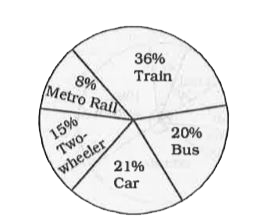
The ratio of two-wheelers and cars being used as modes of transport is
4:7
7:5
5:7
3:5
The correct Answer is:C
Step by step video, text & image solution for The pie chart given below represents the modes of transport for 1400 officers of the Staff Selection Commision, Kolkata. Study the chart and answer the following questions. The ratio of two-wheelers and cars being used as modes of transport is by Maths experts to help you in doubts & scoring excellent marks in Class 14 exams.
Topper's Solved these Questions
- BOOK - KIRAN PUBLICATIONCHAPTER - STATISTICS AND DATA INTERPRETATIONEXERCISE - TYPE-VIII8videos
STATISTICS AND DATA INTERPRETATION
- BOOK - KIRAN PUBLICATIONCHAPTER - STATISTICS AND DATA INTERPRETATIONEXERCISE - TYPE-VI86videos
STATISTICS AND DATA INTERPRETATION
- BOOK - KIRAN PUBLICATIONCHAPTER - SIMPLIFICATIONEXERCISE - TEST YOURSELF25videos
SIMPLIFICATION
- BOOK - KIRAN PUBLICATIONCHAPTER - TIME AND DISTANCEEXERCISE - Type -XI74videos
TIME AND DISTANCE
Similar Questions
The pie-chart shows the breakup in percent age of the various expenses of a Company. Study the diagram and answer the following questions.
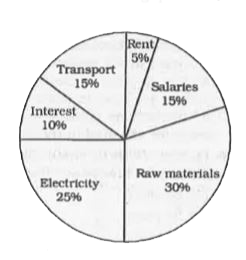
The ratio of company's expenditure on raw material and transport to salaries is:View SolutionThe pie chart given below represents the modes of transport for 1400 officers of the Staff Selection Commision, Kolkata. Study the chart and answer the following questions.
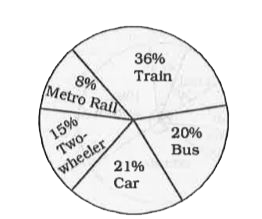
Write down the difference : (officers availing train - officers availaing car)View Solution
Knowledge Check
- Question 1 - Select One
The pie chart given below represents the modes of transport for 1400 officers of the Staff Selection Commision, Kolkata. Study the chart and answer the following questions.

The ratio of two-wheelers and cars being used as modes of transport isA4:7B7:5C5:7D3:5 - Question 2 - Select One
The pie chart given below represents the modes of transport for 1400 officers of the Staff Selectrion Commision, Kolakata. Study the chart and answer the following questions.
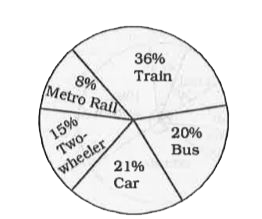
The number of officers who go to office by car isA394B304C214D294 - Question 3 - Select One
The pie chart given below represents the modes of transport for 1400 officers of the Staff Selectrion Commision, Kolakata. Study the chart and answer the following questions.
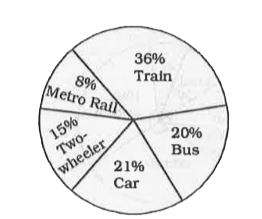
The number of officers who go to office by Metro Rail isA142B132C112D122
The following bar diagram, represents the use of different modes of travel to school by students in a certain locality of the town. Study the graph and answer the questions.
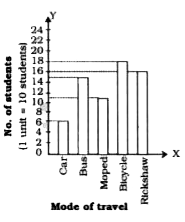
What is the ratio of the students using their means of transport as Car with those using Rickshaw ?View SolutionIn the given pie-chart, the comaprative study of the production or Rice, Wheat, Sugar and Tea of a country is given. Study the pie-chart and answer the following questions.
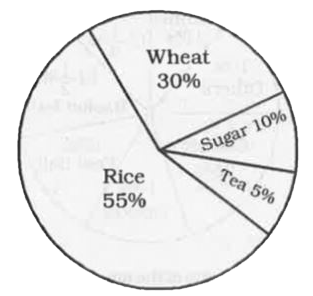
The production of rice and tea is more / greater than production of wheat byView SolutionGiven here is a pie chart showing the cost of gold in 2010, 2011, 2012 and 2013. Study the chart and answer the following questions.
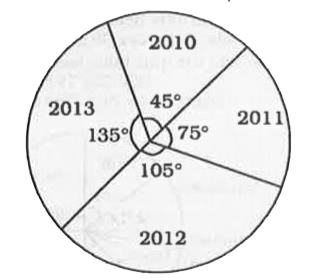
The ratio of the price of gold in the two years 2010 and 2013 isView SolutionStudy the Pie chart carefully and answer the questions.
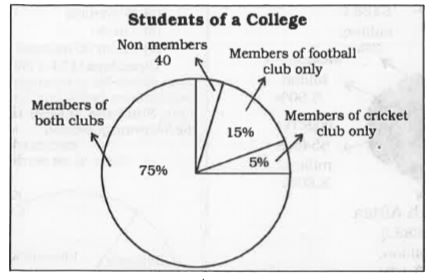
Ratio of members of cricket club only and football club only respectively is :View SolutionIn the given pie-chart, the comaprative study of the production or Rice, Wheat, Sugar and Tea of a country is given. Study the pie-chart and answer the following questions.
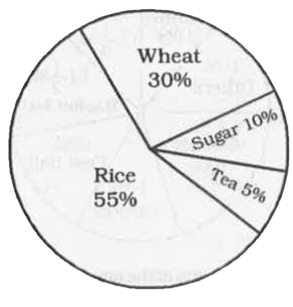
From this diagram, the ratio of sum of wheat and sugar production to difference in production of rice and tea isView Solution

