The Expenditure of a family in a month is represented by a Pie-chart. Read it carefully to answer the questions.
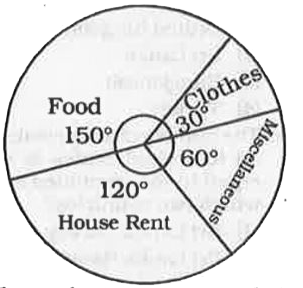
The total money spent on clothes and miscellaneous is :
None of the options
Rs. 900
Rs. 3600
Rs. 2000
The correct Answer is:A
Step by step video, text & image solution for The Expenditure of a family in a month is represented by a Pie-chart. Read it carefully to answer the questions. The total money spent on clothes and miscellaneous is : by Maths experts to help you in doubts & scoring excellent marks in Class 14 exams.
Updated on:21/07/2023Topper's Solved these Questions
- STATISTICS AND DATA INTERPRETATIONBOOK - KIRAN PUBLICATIONCHAPTER - STATISTICS AND DATA INTERPRETATIONEXERCISE - TYPE-VIII
8 Videos
- STATISTICS AND DATA INTERPRETATIONBOOK - KIRAN PUBLICATIONCHAPTER - STATISTICS AND DATA INTERPRETATIONEXERCISE - TYPE-VI
86 Videos
- SIMPLIFICATIONBOOK - KIRAN PUBLICATIONCHAPTER - SIMPLIFICATIONEXERCISE - TEST YOURSELF
25 Videos
- TIME AND DISTANCEBOOK - KIRAN PUBLICATIONCHAPTER - TIME AND DISTANCEEXERCISE - Type -XI
74 Videos
Similar Questions
Following is the pie-chart showing the spendings of a family on various items in a particular year
Study the pie chart and answer questions.
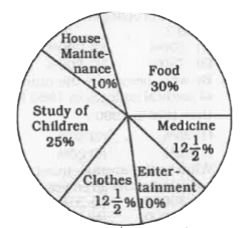
The ratio of the total amount spent for food and medicine is
View SolutionThe expenses of a country for a particular year is given in Pie-Chart. Read the Pie-Chart and answer the questions.
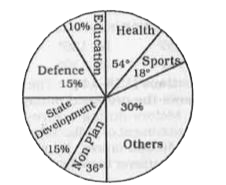
The percent of less money spent on non plan than that on defence is
View Solution
Knowledge Check
The Expenditure of a family in a month is represented by a Pie-chart. Read it carefully to answer the questions.
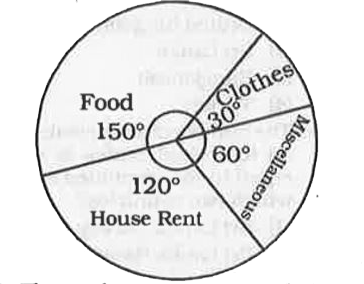
The ratio of the amount spent on food and clothes isA4:1B4:5C5:1D2:5The Expenditure of a family in a month is represented by a Pie-chart. Read it carefully to answer the questions.
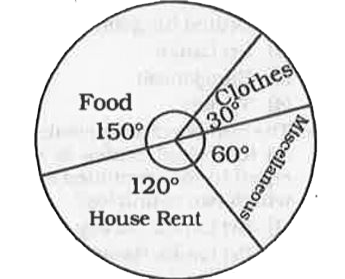
If the total amount spent is Rs. 7,200, find the amount spent on food :ARs. 1500BRs. 6000CRs. 4500DRs. 3000The Expenditure of a family in a month is represented by a Pie-chart. Read it carefully to answer the questions.
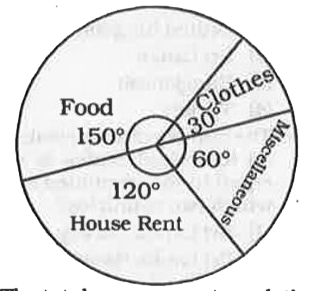
The percentage of money spent on food compared to house rent isA25%B12.5%C50%DNone of these
The expenses of a country for a particular year is given in Pie-Chart. Read the Pie-Chart and answer the questions.
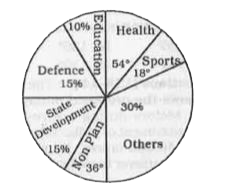
The percent of excess money spent on Others than that on Sport is
View SolutionThe bar diagram shows the monthly expenditure of a company. Study the graph and answer the questions.
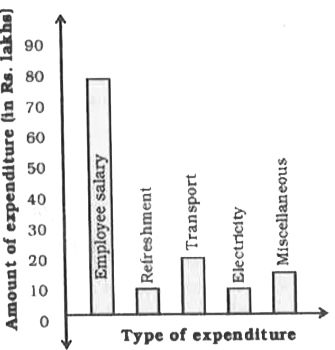
The percentage of money spent on miscellaneous is
View SolutionThe bar diagram shows the monthly expenditure of a company. Study the graph and answer the questions.
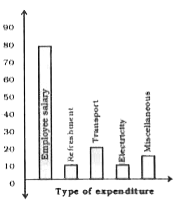
The percentage of money spent on miscellaneous is
View SolutionThe expenses of a country for a particular year is given in Pie-Chart. Read the Pie-Chart and answer the questions.
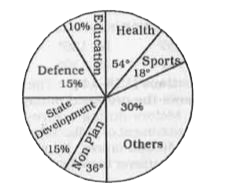
If the total amount spent by the Government during the year was Rs 3,00,000 crores, the spent on state development exceeds that on sport by
View SolutionThe expenses of a country for a particular year is given in Pie-Chart. Read the Pie-Chart and answer the questions.
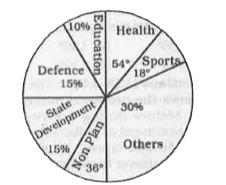
If the total amount spent by the Government during the year was Rs 1,00,000 crores, then the amount spent on Health and Education together was
View Solution
