The following pie chart shows th export of automobiles of India to the 10 countries given below in 2014. The 10 countries imported 47.8% of the total export of India. Observe the chart given below and answer the following question :
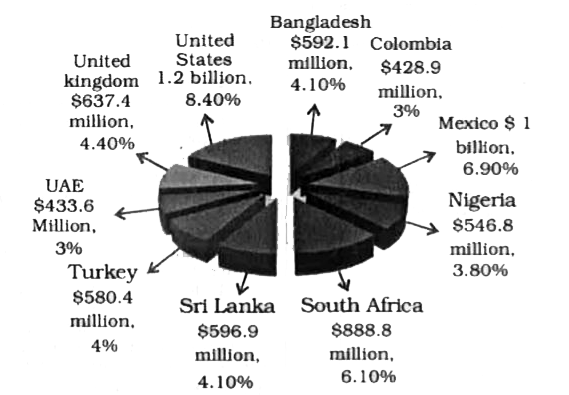
What is the corresponding angle to the exports for Turkey?
14.4∘
15.2∘
12.5∘
17.7∘
The correct Answer is:A
Step by step video, text & image solution for The following pie chart shows th export of automobiles of India to the 10 countries given below in 2014. The 10 countries imported 47.8% of the total export of India. Observe the chart given below and answer the following question : What is the corresponding angle to the exports for Turkey? by Maths experts to help you in doubts & scoring excellent marks in Class 14 exams.
Updated on:21/07/2023Topper's Solved these Questions
- STATISTICS AND DATA INTERPRETATIONBOOK - KIRAN PUBLICATIONCHAPTER - STATISTICS AND DATA INTERPRETATIONEXERCISE - TYPE-VIII
8 Videos
- STATISTICS AND DATA INTERPRETATIONBOOK - KIRAN PUBLICATIONCHAPTER - STATISTICS AND DATA INTERPRETATIONEXERCISE - TYPE-VI
86 Videos
- SIMPLIFICATIONBOOK - KIRAN PUBLICATIONCHAPTER - SIMPLIFICATIONEXERCISE - TEST YOURSELF
25 Videos
- TIME AND DISTANCEBOOK - KIRAN PUBLICATIONCHAPTER - TIME AND DISTANCEEXERCISE - Type -XI
74 Videos
Similar Questions
The following pie chart shows the export of automobiles of India to the 10 countries given below in 2014. The 10 countries imported 47.8% of the total export of India. Observe the chart given below and answer the following question:
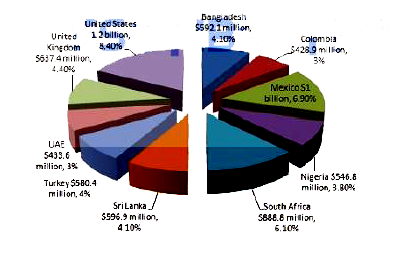
What is the total export value of automobiles?
View SolutionThe following pie chart shows the export of automobiles of India to the 10 countries given below in 2014. The 10 countries imported 47.8% of the total export of India. Observe the chart given below and answer the following question:
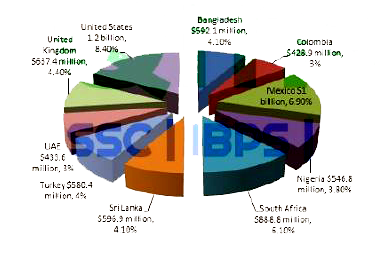
What is the average of imports of the countries UAE, Bangladesh, and Sri Lanka?
View Solution
Knowledge Check
The following pie chart shows th export of automobiles of India to the 10 countries given below in 2014. The 10 countries imported 47.8% of the total export of India. Observe the chart given below and answer the following question :
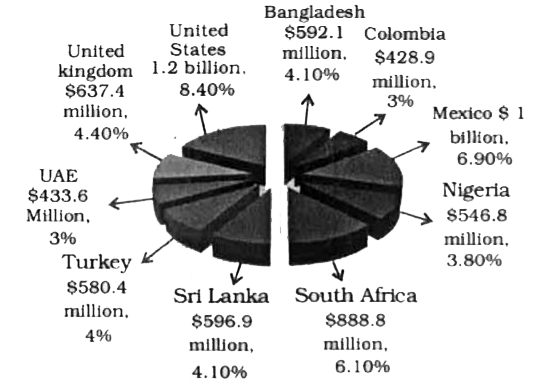
What is the difference in the value of exports between the 3rd and the 7th largest importer?A419.6 millionB308.4 millionC57 millionD128.7 millionThe following pie chart shows th export of automobiles of India to the 10 countries given below in 2014. The 10 countries imported 47.8% of the total export of India. Observe the chart given below and answer the following question :
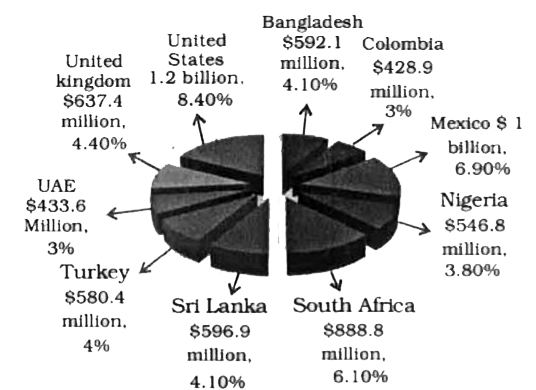
What is the average of imports of the countries UAE, Bangladesh, and Sri Lanka?A580.5 millionB618.6 millionC473.7 millionD540.8 millionThe following pie chart shows th export of automobiles of India to the 10 countries given below in 2014. The 10 countries imported 47.8% of the total export of India. Observe the chart given below and answer the following question :
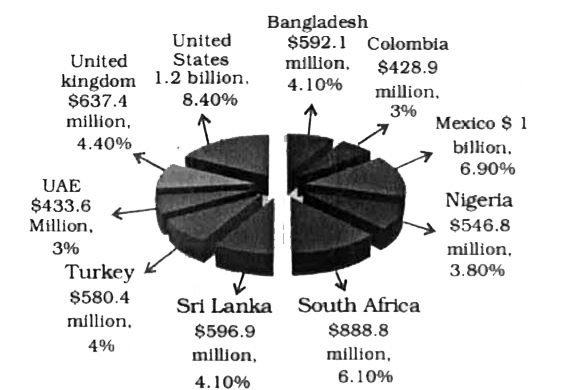
Which country is the fifth largest importer of Automobiles from India?AUnited KingdomBSri LankaCBangladeshDTurkey
The following pie chart shows the export of automobiles of India to the 10 countries given below in 2014. The 10 countries imported 47.8% of the total export of India. Observe the chart given below and answer the following question:
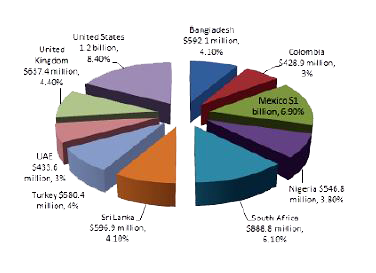
Which country is the fifth largest importer of Automobiles from India?
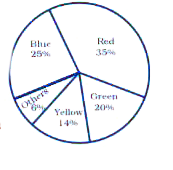
View SolutionObserve the pie chart given below and answer questions based on it.
Which colour received 15 of the votes?
View SolutionThe following Pie Chart shows the export of different foodgrains from India in 2010. Study the chart and answer the questions :
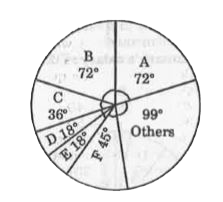
Of the total export of foodgrains, the percentage of crop B exported is
View SolutionThe following pie chart shows th export of automobiles of India to the 10 countries given below in 2014. The 10 countries imported 47.8% of the total export of India. Observe the chart given below and answer the following question :
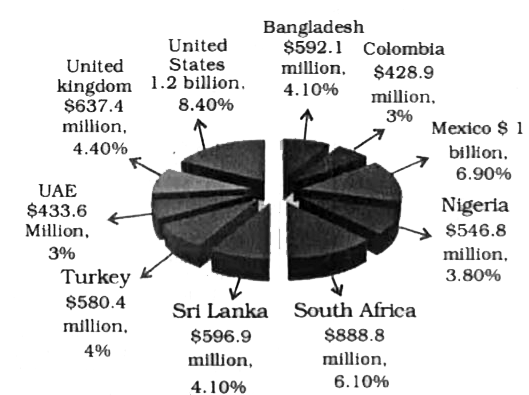
The number of automobile exported to United States is roughly equal to the combined export to which two countries?
View SolutionThe following questions arfe based on the pie-chart given below. Study the pie-chart and answer the questions.
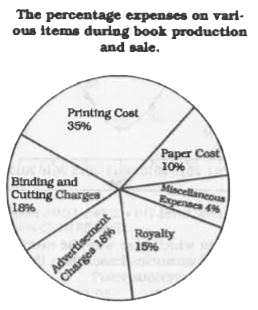
The central angle for the sector on ''Paper-Cost'' is
View Solution
