The given pie-chart shows the distribution (in degrees) of cars sold of difference models by a company in 2015-16.
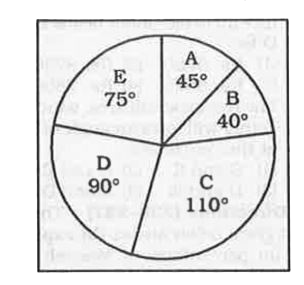
If the number of cars sold of model D is 72900, then what is the total number of cars sold of all the models together by the company ?
291600
208100
162000
214160
The correct Answer is:A
Step by step video, text & image solution for The given pie-chart shows the distribution (in degrees) of cars sold of difference models by a company in 2015-16. If the number of cars sold of model D is 72900, then what is the total number of cars sold of all the models together by the company ? by Maths experts to help you in doubts & scoring excellent marks in Class 14 exams.
Topper's Solved these Questions
- BOOK - KIRAN PUBLICATIONCHAPTER - STATISTICS AND DATA INTERPRETATIONEXERCISE - TYPE-VIII8videos
STATISTICS AND DATA INTERPRETATION
- BOOK - KIRAN PUBLICATIONCHAPTER - STATISTICS AND DATA INTERPRETATIONEXERCISE - TYPE-VI86videos
STATISTICS AND DATA INTERPRETATION
- BOOK - KIRAN PUBLICATIONCHAPTER - SIMPLIFICATIONEXERCISE - TEST YOURSELF25videos
SIMPLIFICATION
- BOOK - KIRAN PUBLICATIONCHAPTER - TIME AND DISTANCEEXERCISE - Type -XI74videos
TIME AND DISTANCE
Similar Questions
The given pie-chart shows the distribution (in degrees) of cars sold of difference models by a company in 2015-16.
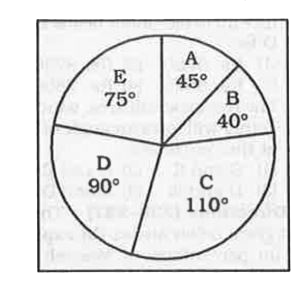
If the number of cars sold of model D is 40500, then how many more cars of models E are sold than that of A ?View SolutionIf 5% of the total number of cars sold of model E is 750, then what is the average number of cars sold of all the models?
View Solution
Knowledge Check
- Question 1 - Select One
The given pie-chart shows the distribution (in degrees) of cars sold of difference models by a company in 2015-16.
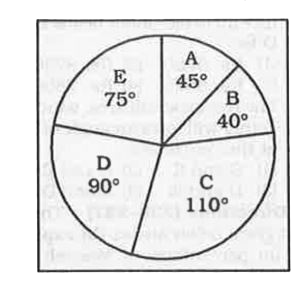
If 5% of the total number of cars sold of model E is 750, then what is the average number of cars sold of all the models ?A15000B14400C16800D14000 - Question 2 - Select One
The given pie-chart shows the distribution (in degrees) of cars sold of difference models by a company in 2015-16.
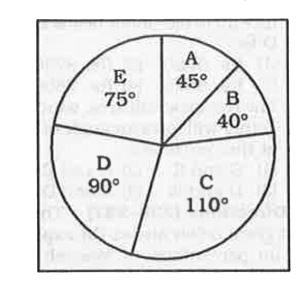
If the number of cars sold of model D is 40500, what is the ratio between the number of cars sold of models D and E ?A9:5B6:5C11:9D9:7 - Question 3 - Select One
The given pie-chart shows the distribution (in degrees) of cars sold of difference models by a company in 2015-16.
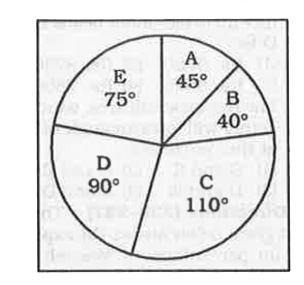
If number of cars sold of model C are 22000, then what will be the difference in the number of cars sold of models A and B ?A800B1200C1000D1500
If the number of cars sold of model D is 40500, what is the ratio between the number of cars sold of model D and E?
View SolutionIf number of cars sold of model C are 22000, then what will be the difference in the number of cars sold of model A and B?
View SolutionIf the number of cars sold of model D is 40500, then how many more cars of model E are sold than that of A?
View SolutionThe given table represents the sale (in thousands) of cars by four companies A,B,C and D in six years. Study the table and answer the questions that follow:
दी गयी तालिका चार कंपनियों - A, B, C और D के द्वारा छः वर्षों में की गयी कारों की बिक्री ( हज़ार में ) दर्शाती है | इस तालिका का अध्ययन करें तथा फिर पूछे गए प्रश्नों के उत्तर दें |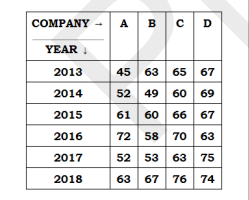 What is the ratio of total number of cars sold by companies A,B and D in 2017 to the total number
of cars sold by all companies in 2018?
कंपनी A, B और D के द्वारा 2017 में बेची गयी कारों की कुल संख्या तथा 2018 में सभी कंपनियों के द्वारा बेची गयी कारों की कुल संख्या के बीच क्या अनुपात है ?View SolutionThe table shows the number of cars sold by three showrooms over a period of six years.
यह तालिका तीन शोरूम द्वारा छः वर्षों की अवधि में बेची गयी कारों की संख्या दर्शाती है |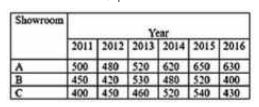 What is the average number of cars sold by showroom A over the given six years (nearest to one decimal place)?
दिए गए छः वर्षों में शोरूम A द्वारा बेची गयी कारों की औसत संख्या कितनी है ? (एक दशमलव स्थान के निकटतम )View Solution

