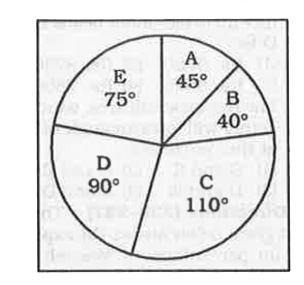
The given pie-chart shows the distribution (in degrees) of cars sold of difference models by a company in 2015-16.
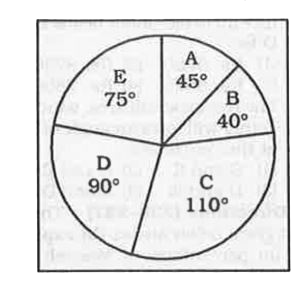
If 5% of the total number of cars sold of model E is 750, then what is the average number of cars sold of all the models ?
15000
14400
16800
14000
The correct Answer is:B
Step by step video, text & image solution for The given pie-chart shows the distribution (in degrees) of cars sold of difference models by a company in 2015-16. If 5% of the total number of cars sold of model E is 750, then what is the average number of cars sold of all the models ? by Maths experts to help you in doubts & scoring excellent marks in Class 14 exams.
Topper's Solved these Questions
- BOOK - KIRAN PUBLICATIONCHAPTER - STATISTICS AND DATA INTERPRETATIONEXERCISE - TYPE-VIII8videos
STATISTICS AND DATA INTERPRETATION
- BOOK - KIRAN PUBLICATIONCHAPTER - STATISTICS AND DATA INTERPRETATIONEXERCISE - TYPE-VI86videos
STATISTICS AND DATA INTERPRETATION
- BOOK - KIRAN PUBLICATIONCHAPTER - SIMPLIFICATIONEXERCISE - TEST YOURSELF25videos
SIMPLIFICATION
- BOOK - KIRAN PUBLICATIONCHAPTER - TIME AND DISTANCEEXERCISE - Type -XI74videos
TIME AND DISTANCE
Similar Questions
The given pie-chart shows the distribution (in degrees) of cars sold of difference models by a company in 2015-16.
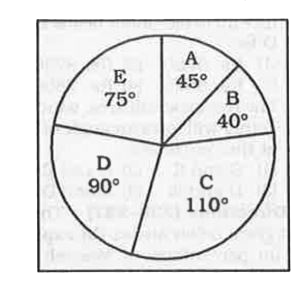
If the number of cars sold of model D is 40500, then how many more cars of models E are sold than that of A ?View SolutionIf the number of cars sold of model D is 72900, then what is the total number of cars sold of all the models together by the company?
View Solution
Knowledge Check
- Question 1 - Select One
The given pie-chart shows the distribution (in degrees) of cars sold of difference models by a company in 2015-16.
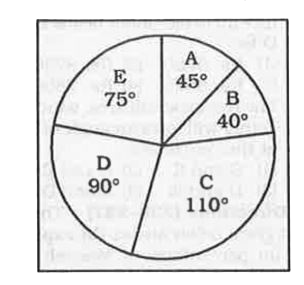
If the number of cars sold of model D is 72900, then what is the total number of cars sold of all the models together by the company ?A291600B208100C162000D214160 - Question 2 - Select One
The given pie-chart shows the distribution (in degrees) of cars sold of difference models by a company in 2015-16.
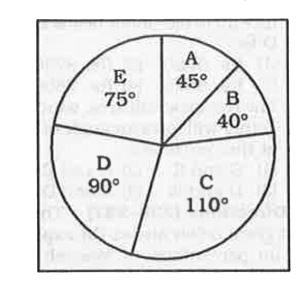
If the number of cars sold of model D is 40500, what is the ratio between the number of cars sold of models D and E ?A9:5B6:5C11:9D9:7 - Question 3 - Select One
The given pie-chart shows the distribution (in degrees) of cars sold of difference models by a company in 2015-16.
If number of cars sold of model C are 22000, then what will be the difference in the number of cars sold of models A and B ?A800B1200C1000D1500
If the number of cars sold of model D is 40500, what is the ratio between the number of cars sold of model D and E?
View SolutionIf number of cars sold of model C are 22000, then what will be the difference in the number of cars sold of model A and B?
View SolutionIf the number of cars sold of model D is 40500, then how many more cars of model E are sold than that of A?
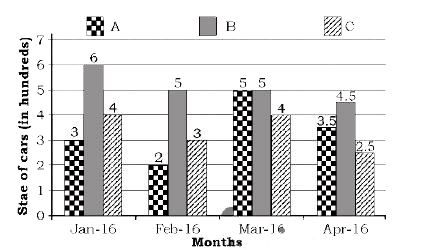
View SolutionWhat was the average number of cars sold by A during Feb-Apr 2016
 View Solution
The table shows the number of cars sold by three showrooms over a period of six years.
यह तालिका तीन शोरूम द्वारा छः वर्षों की अवधि में बेची गयी कारों की संख्या दर्शाती है |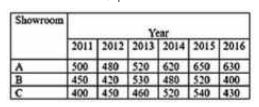 What is the average number of cars sold by showroom A over the given six years (nearest to one decimal place)?
दिए गए छः वर्षों में शोरूम A द्वारा बेची गयी कारों की औसत संख्या कितनी है ? (एक दशमलव स्थान के निकटतम )View Solution
