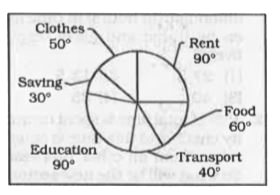
The following pie chart shows the distribution of expenses (in degrees) of a family during 2016. Total income of the family in 2016 = Rs. 1080000
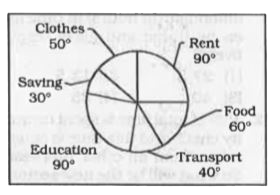
What is the total expenditure (in Rs.) on Rent, Food and Transport together?
450000
390000
570000
500000
The correct Answer is:C
Step by step video, text & image solution for The following pie chart shows the distribution of expenses (in degrees) of a family during 2016. Total income of the family in 2016 = Rs. 1080000 What is the total expenditure (in Rs.) on Rent, Food and Transport together? by Maths experts to help you in doubts & scoring excellent marks in Class 14 exams.
Updated on:21/07/2023Topper's Solved these Questions
- STATISTICS AND DATA INTERPRETATIONBOOK - KIRAN PUBLICATIONCHAPTER - STATISTICS AND DATA INTERPRETATIONEXERCISE - TYPE-VIII
8 Videos
- STATISTICS AND DATA INTERPRETATIONBOOK - KIRAN PUBLICATIONCHAPTER - STATISTICS AND DATA INTERPRETATIONEXERCISE - TYPE-VI
86 Videos
- SIMPLIFICATIONBOOK - KIRAN PUBLICATIONCHAPTER - SIMPLIFICATIONEXERCISE - TEST YOURSELF
25 Videos
- TIME AND DISTANCEBOOK - KIRAN PUBLICATIONCHAPTER - TIME AND DISTANCEEXERCISE - Type -XI
74 Videos
Similar Questions
In the given pie chart what is the total expenditure on rent
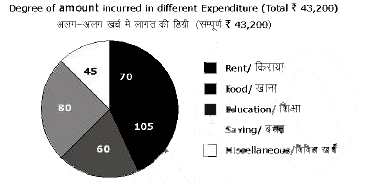
View SolutionThe following pie chart shows the expenditure (in percentage) of the five companies P,Q,R,S and T in the year 2016 .
Total Expenditure = Rs. 48 crores
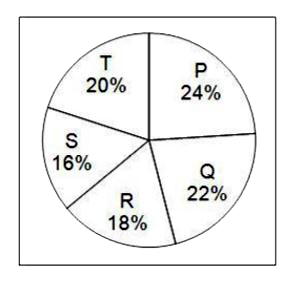
What was the total expenditure (in Rs crores) of the company Q, R and P together?
View Solution
Knowledge Check
The following pie chart shows the distribution of expenses (in degrees) of a family during 2016. Total income of the family in 2016 = Rs. 1080000
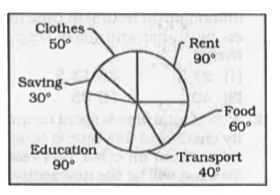
How much do they spend (in Rs.) on clothes?A150000B180000C200000D240000The following pie chart shows the distribution of expenses (in degrees) of a family during 2016. Total income of the family in 2016 = Rs. 1080000
What will be the average (in Rs.) of total income spent by the family on Education, Savings and Rent?A220000B215000C205000D210000The following pie chart shows the distribution of expenses (in degrees) of a family during 2016. Total income of the family in 2016 = Rs. 1080000
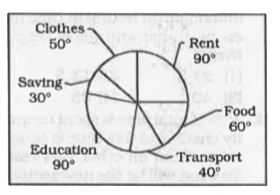
Their expenditure on rent is what per cent of their expenditure on Education?A33.33B50C100D90
The following pie chart shows the distribution of expenses (in degrees) of a family during 2016. Total income of the family in 2016 = Rs. 1080000
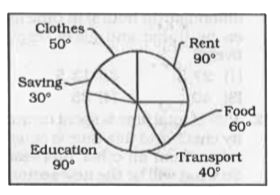
Income of family in the year 2015 was 20% less than that in the year 2016 and the ratio of their savings in 2015 and 2016 is 2:5. Approximately what percentage they saved in the year 2015?
View SolutionThe given pie chart shows the distribution of expenditure of a company (in percentage) . The total expenditure of the company is Rs. 136000.
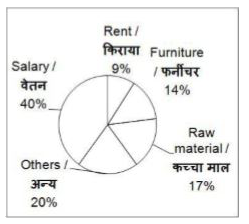
What is the total expenditure (in Rs) incurred on Furniture and Others by the company?
View SolutionThe given pie chart shows the distribution of expenditure of a company (in percenatge). The total expenditure of the company is Rs. 136000.
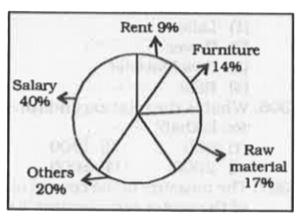
What is the total expenditure (in Rs.) incurred on Furniture and Others by the company?
View SolutionThe pie chart given below shows the monthly expenses on various heads of a family . The total expenditure of the family is Rs 30000.
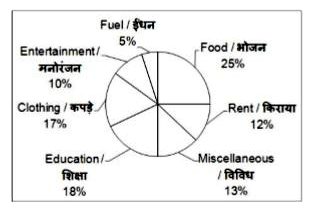
What is the total amount (in Rs) spent on fuel and education ?
View SolutionThe pie chart given below shows the monthly expenses on various heads of a family . The total expenditure of the family is Rs 30000.
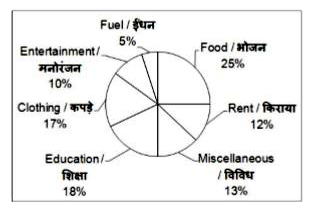
What is the amount (in Rs) spent on food ?
View Solution
