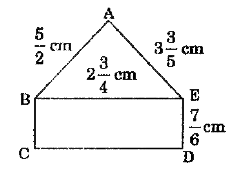
Find the perimeter of
the rectangle BCDE in the figure.
Whose perimeter is greater ?
 Solution in Punjabi
The correct Answer is:756 cm
the perimeter of triangle is greater than rectangle
Step by step video, text & image solution for Find the perimeter of the rectangle BCDE in the figure. Whose perimeter is greater ? by Maths experts to help you in doubts & scoring excellent marks in Class 7 exams.
Updated on:21/07/2023Topper's Solved these Questions
- FRACTIONS AND DECIMALS BOOK - NAND LAL PUBLICATIONCHAPTER - FRACTIONS AND DECIMALS EXERCISE - Exercise 2.2
26 Videos
- FRACTIONS AND DECIMALS BOOK - NAND LAL PUBLICATIONCHAPTER - FRACTIONS AND DECIMALS EXERCISE - Exercise 2.3
25 Videos
- FRACTIONS AND DECIMALS BOOK - NAND LAL PUBLICATIONCHAPTER - FRACTIONS AND DECIMALS EXERCISE - Think, Discuss and Write
2 Videos
- EXPONENTS AND POWERS BOOK - NAND LAL PUBLICATIONCHAPTER - EXPONENTS AND POWERS EXERCISE - SAMPLE PAPER FOR PRACTICE
8 Videos
- INTEGERS BOOK - NAND LAL PUBLICATIONCHAPTER - INTEGERS EXERCISE - SAMPLE PAPER FOR PRACTICE
25 Videos
Similar Questions
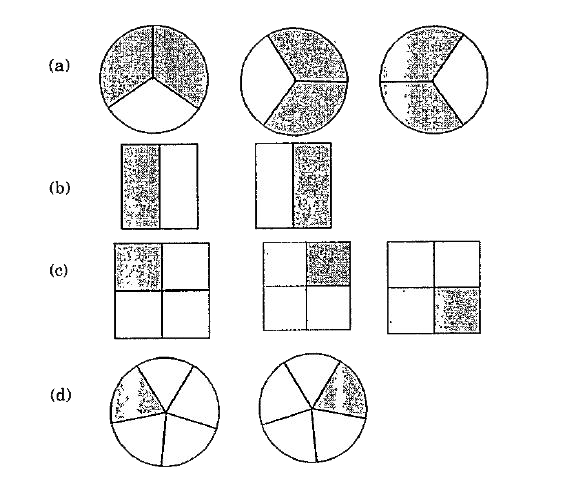
Write of the drawing (a) to (d) show :
(i) 2×15 (ii) 2×12 (iii) 3×23 (iv) 3×14

View SolutionFind :
14 of (a) 14 (b) 35 (c ) 43
View SolutionWill the reciprocal of a proper fraction be again a proper fraction?
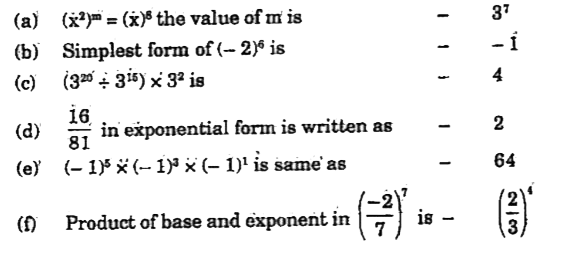
View SolutionMatch the following

View SolutionFill in the blanks
……. Is the greatest negative integer .
View SolutionHow many lines of symmetry does the above figure have ?
View SolutionDetermine the point of symmetry of a regular hexagon.
View SolutionDtermine the images of the following figure about the given line :
View SolutionMatch the following Column A to Column B

View SolutionMatch the following Column A to Column B

View SolutionMatch the following Column A to Column B

View SolutionFind the area of figure given below.

View SolutionFind the perimeter of the figure given below.

View SolutionFind the area of the figure given below.

View SolutionThe area of the shaded part in the figure given below is ______.

View SolutionThe inequation represented by the graph given below is :
View Solution
