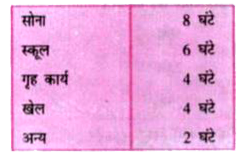
Draw a pie chart of the data given below:
The time spent by a child during a day.
Play = 4 hoursSolution in Punjabi
Step by step video & image solution for Draw a pie chart of the data given below:The time spent by a child during a day.Play = 4 hours by Maths experts to help you in doubts & scoring excellent marks in Class 8 exams.
Updated on:21/07/2023Topper's Solved these Questions
- DATA HANDLING BOOK - NAND LAL PUBLICATIONCHAPTER - DATA HANDLING EXERCISE - EXERCISE-5.1
2 Videos
- DATA HANDLING BOOK - NAND LAL PUBLICATIONCHAPTER - DATA HANDLING EXERCISE - EXERCISE-5.2
5 Videos
- DATA HANDLING BOOK - NAND LAL PUBLICATIONCHAPTER - DATA HANDLING EXERCISE - Think, Discuss and Write
2 Videos
- CUBES AND CUBE ROOTSBOOK - NAND LAL PUBLICATIONCHAPTER - CUBES AND CUBE ROOTSEXERCISE - Sample Paper For Practice
18 Videos
- DIRECT AND INVERSE PROPORTIONSBOOK - NAND LAL PUBLICATIONCHAPTER - DIRECT AND INVERSE PROPORTIONSEXERCISE - SAMPLE PAPER FOR PRACTICE ( Fill in the blanks )
17 Videos
Similar Questions
For which of these would you use a histogram to show the data : The number of letters for different areas in a postman’s bag. Give reasons for each
View SolutionA survey was made to find the type of music that a certain group of young people liked in a city. Adjoining pie chart shows the findings of this survey.

Find this pie chart answer the following
(i) If 20 people liked classical music, how many young people were surveyed?
(ii) Which type of music is liked by the maximum number of people?
(iii) If a cassette company were to make 1000 CD's how many of each type would they make?
View SolutionWhich form of graph would be appropriate to display the following data
Production of food grains of a state

View SolutionCube of a natural number 5 will end with the digit
View SolutionSpeed of moving objects varies inversely to the ________ to cover a certain distance.
View SolutionDraw a pie chart of the data given below. The times spent by a child during a day.

View Solutionनीचे दिए आँकड़ों के लिए एक पाई चार्ट खींचिए :
एक बच्चे द्वारा एक दिन में व्यतीत किया गया समय इस प्रकार है:

View SolutionDraw a pie chart for the following data.

View SolutionDraw a pie chart for the following data. Time spent by a child during a day-

View SolutionDraw a pie chart for the following data
View SolutionA pie chart is given below, which shows the time spent by a group of 350 children in different games. Watch it and answer the questions that follow How many children spend at least one hour playing daily?
View SolutionA pie chart is given below, which shows the time spent by a group of 350 children in different games. Watch it and answer the questions that follow How many children spend more than 2 hours playing?
View SolutionA pie chart is given below, which shows the time spent by a group of 350 children in different games. Watch it and answer the questions that follow How many children spend 3 or less hours playing?
View SolutionIn the time table of a school, the periods allotted for different subjects per week are given below? Draw a pie chart for these data.
View SolutionIn the time table of a school, periods allotted per week to different teaching subjects are given below:

Draw a pie chart for this data.
View SolutionDraw a pie chart of the data given below:
The time spent by a child during a day.
Sleep = 8 hours
View Solution
