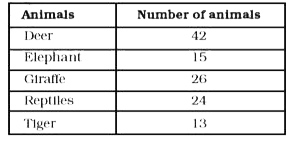
In the time table of a school, periods allotted per week to different teaching subjects are given below:

Draw a pie chart for this data.
Step by step video & image solution for In the time table of a school, periods allotted per week to different teaching subjects are given below: Draw a pie chart for this data. by Maths experts to help you in doubts & scoring excellent marks in Class 8 exams.
Updated on:21/07/2023Topper's Solved these Questions
- DATA HANDLINGBOOK - NCERT EXEMPLARCHAPTER - DATA HANDLINGEXERCISE - EXERCISE (True or False)
23 Videos
- COMPARING QUANTITIESBOOK - NCERT EXEMPLARCHAPTER - COMPARING QUANTITIESEXERCISE - Think and Discuss
2 Videos
- DIRECT AND INVERSE PROPORTIONS BOOK - NCERT EXEMPLARCHAPTER - DIRECT AND INVERSE PROPORTIONS EXERCISE - THINK AND DISCUSS
2 Videos
Similar Questions
Knowledge Check
The pie chart shyows how the school funds is spent under different heads in a certain school. Using the pie chart answer the questions.

What percentage of the total expense is spent on library?A24.3B24C20D16.6
The sales of a shopkeeper in the first week of january 2012, are given below :

Draw a graph representing the above data.
View SolutionThe number of students in a hostel, speaking different languages is given below. Display the data in a pie chart.

View SolutionThe top speeds of 30 different land animals have been organised into a frequency table given below:

Draw a histogram for the given data.
View SolutionThe following table shows the percentage of people having different blood groups. Draw a pie chart to represent the given data.
Blood groupABCDPercentage of people20452015
View SolutionFor the development of basic infrastructure in a district, a project of Rs 108 crore approved by Development Bank is as follows:

Draw a pie chart for this data.
View SolutionThe following table shows the household expenditure of family on different items. Draw a pie chart to represent the given data.
ItemRentFoodClotingEducationOthersExpenditure25%30%10%15%20%
View SolutionThe following table shows the percentage of buyers of four different brands of bathing soaps.

Represent the above data by a pie chart.
View Solution


