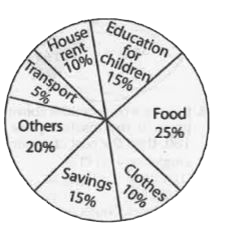
The pie chart given below gives the expenses in % on various items along with the savings of a family.
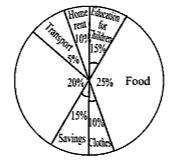
Find the :
Minimum and maximum expenses made on which area?
Which expense/expenses are equal to the saving of the family?
If the monthly savings is Rs. 4,500, find the expenses made on clothes. Solution in Punjabi
Step by step video & image solution for The pie chart given below gives the expenses in % on various items along with the savings of a family. Find the : Minimum and maximum expenses made on which area? Which expense/expenses are equal to the saving of the family? If the monthly savings is Rs. 4,500, find the expenses made on clothes. by Maths experts to help you in doubts & scoring excellent marks in Class 8 exams.
Updated on:21/07/2023Topper's Solved these Questions
- DATA HANDLING BOOK - NAND LAL PUBLICATIONCHAPTER - DATA HANDLING EXERCISE - SAMPLE PAPER FOR PRACTICE (Fill in the blanks)
4 Videos
- CUBES AND CUBE ROOTSBOOK - NAND LAL PUBLICATIONCHAPTER - CUBES AND CUBE ROOTSEXERCISE - Sample Paper For Practice
18 Videos
- DIRECT AND INVERSE PROPORTIONSBOOK - NAND LAL PUBLICATIONCHAPTER - DIRECT AND INVERSE PROPORTIONSEXERCISE - SAMPLE PAPER FOR PRACTICE ( Fill in the blanks )
17 Videos
Similar Questions
In a pie chart, sum of all central angles must be _______ .
View SolutionCube of a natural number 5 will end with the digit
View SolutionSpeed of moving objects varies inversely to the ________ to cover a certain distance.
View Solutionएक परिवार की आय और खर्च का अनुपात 10:7 है। यदि परिवार का खर्च रू 10500 है। तो परिवार की बचत ज्ञात करे।
View Solutionshyan's monthly income ia 10,000. he spends 60% of it on family expenses, medical expenses, 5% on donations and saves by 25% .find the amount be spends an each item?
View SolutionIn the Chidambaram's family the ratio of expenses to the savings is 5:3. But his expenses is increased by 60% and income increases by only 25% thus there is a deficit of Rs. 3500 in the savings. The incrased income of Mr. Chidambaram's family is :
View SolutionThe pie chart, given here shows monthly expenses on various heads and savings of the family of Mr. Rao. Study the chart and answer the questions based on it.
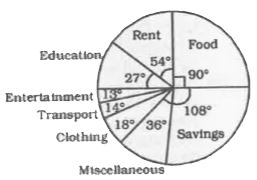
The amount spent on food exceeds the total amount spent on education and clothing by
View SolutionThe pie chart, given here shows monthly expenses on various heads and savings of the family of Mr. Rao. Study the chart and answer the questions based on it.
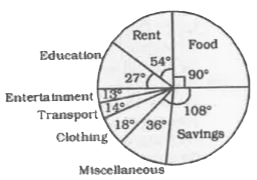
What per cent of his income does Mr. Rao save?
View SolutionThe following pie-chart shows the monthly expenditure of a family on food, clothing, rent, miscellaneous expenses and savings. If the family spends Rs. 825 on clothing, answer the following questions: (i) What is the total monthly income of the family? (ii) What percent of the total income does the family save?
View SolutionA part of monthly expenses of a family is constant and the remaining vary with the number of members in the family. For a family of 4 persons, the total monthly expenses are < 10,400, whereas for a family of 7 persons, the total monthly expenses are 15,800. Find the constant expenses per month and the monthly expenses on each member of a family.
View SolutionShyam's monthly Income is ₹10,000. He spends 60% of it on family expenses 10% on medical expenses, 5% on donations and saves by 25% Find the amount he spends on each item?
View SolutionThe pie chart given below shows the expenses incurred and saving by a family in a month. What is the percentage of expenses incurred on account of recreation ?
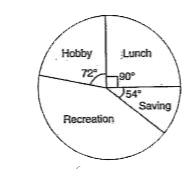
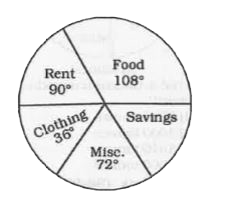
View SolutionThe following pie - chart shows the monthly expenditure of a family on food, clothing, rent, miscellaneous expenses and savings. What is the central angle for savings ?
View SolutionThe pie - chart gives the expenditure (in percentage) on various items and savings of a family during a month. Monthly savings of the family is Rs 3, 000. On which item is the expenditure maximum and how much is it ?
View SolutionThe pie chart, given here shows monthly expenses on various heads and savings of the family of Mr. Rao. Study the chart and answer the questions based on it. The amount spent on food exceeds the total amount spent on education and clothing by
View Solution
