The following pie-chart shows the monthly expenditure of a family on food, clothing, rent, miscellaneous expenses and savings. If the family spends Rs. 825 on clothing, answer the following questions: (i) What is the total monthly income of the family? (ii) What percent of the total income does the family save?
Let's solve the problem step by step.
Step 1: Understand the relationship between the angle in the pie chart and the expenditure.
The pie chart represents the monthly expenditure of the family. The angle for clothing is given as 36 degrees, which corresponds to an expenditure of Rs. 825.
Step 2: Calculate the total monthly income of the family.
Since the entire pie chart represents the total monthly income, which corresponds to 360 degrees, we can set up a proportion to find the total income.
If 36 degrees=825 Rs, then 360 degrees=x Rs
We can set up the equation:
36360=825x
Step 3: Cross-multiply to solve for x.
Cross-multiplying gives us:
36x=360×825
Step 4: Simplify the equation.
Now, calculate 360×825:
360×825=297000
So, we have:
36x=297000
Step 5: Solve for x.
Now, divide both sides by 36:
x=29700036
Calculating this gives:
x=8250
Thus, the total monthly income of the family is Rs. 8250.
Step 6: Calculate the percentage of total income that the family saves.
From the pie chart, we know that the savings correspond to 54 degrees. We can find the percentage of savings using the formula:
Percentage of savings=(Savings angleTotal angle)×100
Substituting the values:
Percentage of savings=(54360)×100
Step 7: Simplify the percentage calculation.
Calculating this gives:
Percentage of savings=(54360)×100=54×100360
Step 8: Calculate the final percentage.
5400360=15
Thus, the family saves 15% of their total income.
Final Answers:
(i) The total monthly income of the family is Rs. 8250.
(ii) The family saves 15% of their total income.
---
The pie chart represents the monthly expenditure of the family. The angle for clothing is given as 36 degrees, which corresponds to an expenditure of Rs. 825.
Since the entire pie chart represents the total monthly income, which corresponds to 360 degrees, we can set up a proportion to find the total income.
Cross-multiplying gives us:
Now, calculate 360×825:
Now, divide both sides by 36:
From the pie chart, we know that the savings correspond to 54 degrees. We can find the percentage of savings using the formula:
Calculating this gives:
5400360=15
(i) The total monthly income of the family is Rs. 8250.
(ii) The family saves 15% of their total income.
Topper's Solved these Questions
Similar Questions
The following pie-chart shows the monthly expenditure of Shikha on various items. If she spends Rs. 16000 per month, answer the following questions: How much does she spend on rent? How much does she spend on education? What is the ratio of expenses on food and rent?
View SolutionThe following pie-chart shows the number of students admitted in different feculties of a college. If 1000 students are admitted in Science answer the following:
(i) What is the total number of students?
(ii) What is the ratio of students in science and arts?
View SolutionThe ratio of the income to the expenditure of a family is 7:6. Find the saving if the income is Rs 1400.
View SolutionThe ratio of the income to the expenditure of a family is 7:6. Find the saving if the income is Rs 1400.
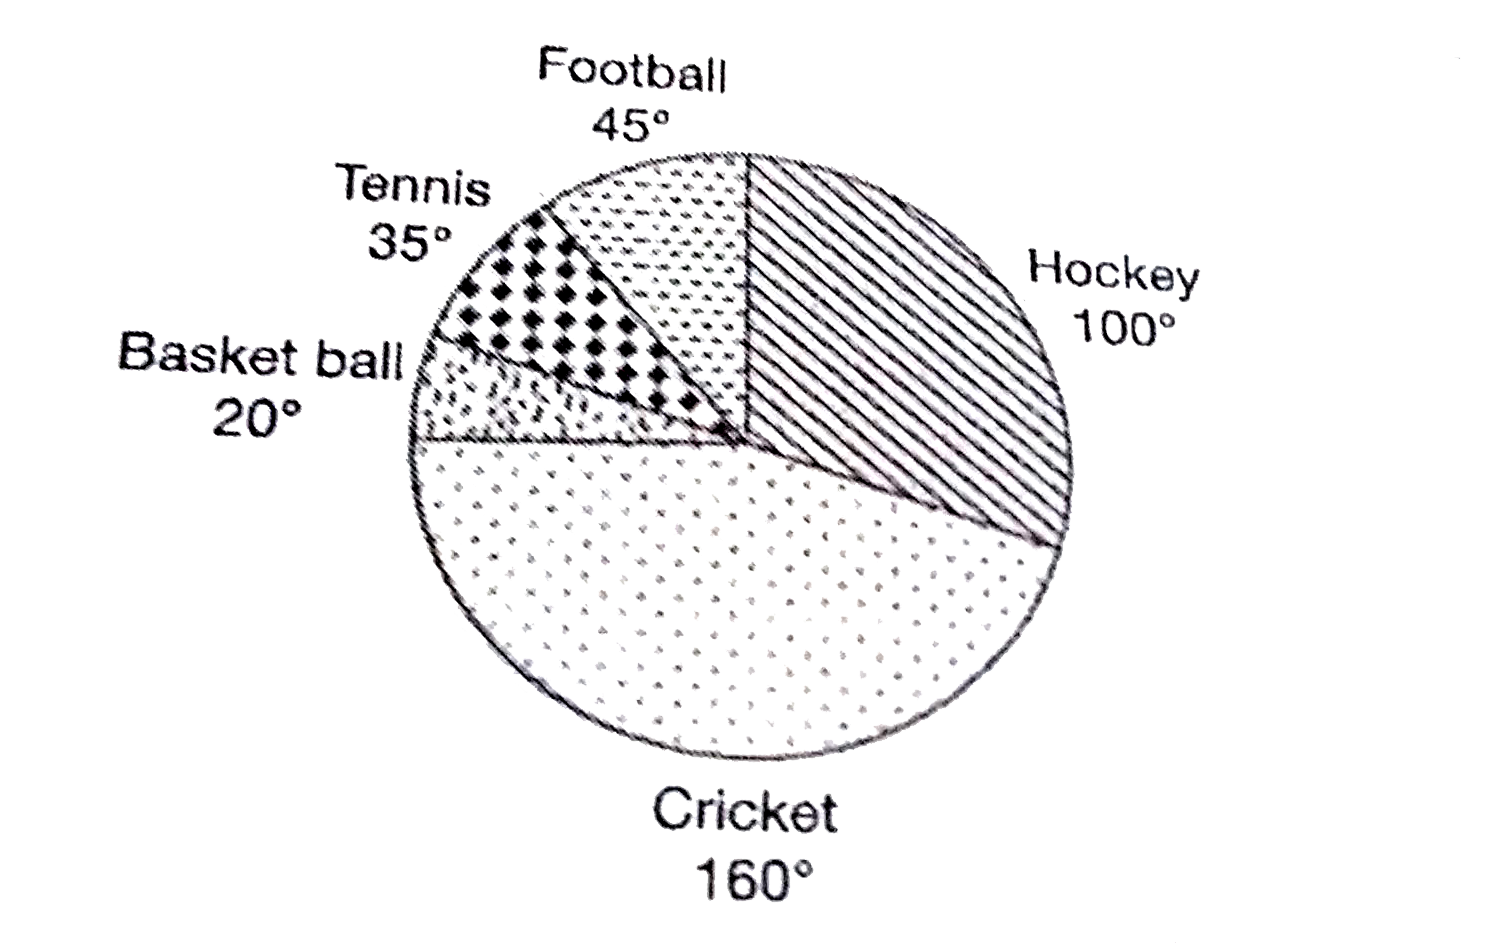
View SolutionThe following pie-chart represents the amount spent on different sports by a school administration in a calendar year.

If the money spent on football is Rs. 9000, answer the following questions:
(i) If the amount spent on football was Rs. 9000, then how much more money was spent on hockey than on football ?
(ii) If the amount spent on football Rs. 9000, then what was the total amount spent on all sports ?
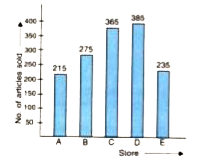
View SolutionThe given bar graph shows the number of identical articles sold by 5 different stores A, B, C, D and E during a particular month.

Study the bar graph and answer the following questions :
(i) Which store sold the largest number of articles ?
(ii) By what per cent is the sale of store D more than that of store B ?
(iii) Find the ratio of the total sale of the two highest selling stores to the total sale of the two least selling stores.
(iv) By how much must store E increase its sale to catch up with its nearest rival store ?
View SolutionThe pie-chart shown in Figure represents the expenditures of a family on different items.If the total annual income of the family is Rs.75,000, Find the expenditure on children education and also find savings by reading the pie-chart.
View SolutionThe following data gives the distribution of total monthly household expenditure of 200 families of a village. Find the modal monthly expenditure of the families. Also, find the mean monthly expenditure:
View SolutionThe following bar graph shows the number of vehicles passing through a road crossing in Delhi in different time intervals on a particular day. Read the bar graph and answer the following questions: What does the bar graph represent? Also, give the maximum number of vehicles. When is the hourly traffic maximum? Also give the minimum number of vehicles. When is the hourly traffic minimum? What is the total number of vehicles passing through a crossing during a particular day?
View SolutionDraw a pie-diagram for the following data of expenditure pattern in a family: Items, Food, Clothing, Rent, Edu., Misc. Expenditure (in Rs.), 4000, 2000, 1500, 1500, 1000
View Solution
