Which of the following graphs relates V and T?
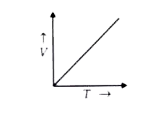


The correct Answer is:A
To solve the question of which graph relates volume (V) and temperature (T) according to Charles' Law, we can follow these steps:
Step 1: Understand Charles' Law
Charles' Law states that at constant pressure, the volume of a gas is directly proportional to its absolute temperature (in Kelvin). This can be expressed mathematically as:
V∝T
or
V=kT
where k is a constant.
Step 2: Identify the Relationship
Since volume is directly proportional to temperature, if the temperature increases, the volume will also increase, and vice versa. This indicates a linear relationship between V and T.
Step 3: Analyze the Graph Options
1. Option 1: A straight line passing through the origin. This represents a direct proportionality, which aligns with Charles' Law.
2. Option 2: A hyperbolic curve. This indicates an inverse relationship, which does not apply here.
3. Option 3: A horizontal line. This suggests that volume does not change with temperature, which contradicts Charles' Law.
4. Option 4: A straight line that does not pass through the origin. This would imply a non-zero intercept, indicating that volume does not start from zero when temperature is zero, which is incorrect for an ideal gas.
Step 4: Conclusion
Based on the analysis, Option 1 is the correct graph that relates volume (V) and temperature (T) according to Charles' Law.
Final Answer
The correct graph that relates V and T is Option 1.
---
Charles' Law states that at constant pressure, the volume of a gas is directly proportional to its absolute temperature (in Kelvin). This can be expressed mathematically as:
V∝T
or
V=kT
where k is a constant.
Since volume is directly proportional to temperature, if the temperature increases, the volume will also increase, and vice versa. This indicates a linear relationship between V and T.
1. Option 1: A straight line passing through the origin. This represents a direct proportionality, which aligns with Charles' Law.
2. Option 2: A hyperbolic curve. This indicates an inverse relationship, which does not apply here.
3. Option 3: A horizontal line. This suggests that volume does not change with temperature, which contradicts Charles' Law.
4. Option 4: A straight line that does not pass through the origin. This would imply a non-zero intercept, indicating that volume does not start from zero when temperature is zero, which is incorrect for an ideal gas.
Based on the analysis, Option 1 is the correct graph that relates volume (V) and temperature (T) according to Charles' Law.
The correct graph that relates V and T is Option 1.
Topper's Solved these Questions
- BOOK - MTG IIT JEE FOUNDATIONCHAPTER - MOLE CONCEPT, STOICHIOMETRY AND BEHAVIOUR OF GASES EXERCISE - EXERCISE (MATCH THE FOLLOWING)5videos
MOLE CONCEPT, STOICHIOMETRY AND BEHAVIOUR OF GASES
- BOOK - MTG IIT JEE FOUNDATIONCHAPTER - MOLE CONCEPT, STOICHIOMETRY AND BEHAVIOUR OF GASES EXERCISE - EXERCISE (ASSERTION & REASON TYPE)10videos
MOLE CONCEPT, STOICHIOMETRY AND BEHAVIOUR OF GASES
- BOOK - MTG IIT JEE FOUNDATIONCHAPTER - MOLE CONCEPT, STOICHIOMETRY AND BEHAVIOUR OF GASES EXERCISE - SOLVED EXAMPLES13videos
MOLE CONCEPT, STOICHIOMETRY AND BEHAVIOUR OF GASES
- BOOK - MTG IIT JEE FOUNDATIONCHAPTER - METALS AND NON METALS EXERCISE - Olympiad/HOTS Corner20videos
METALS AND NON METALS
- BOOK - MTG IIT JEE FOUNDATIONCHAPTER - PERIODIC CLASSIFICATION OF ELEMENTSEXERCISE - Olympiad/HOTS Corner15videos
PERIODIC CLASSIFICATION OF ELEMENTS
Similar Questions
Knowledge Check
- Question 1 - Select One
Which of the following graph depicts relation between time period (T) and radius of orbit (r) of a planet ?
A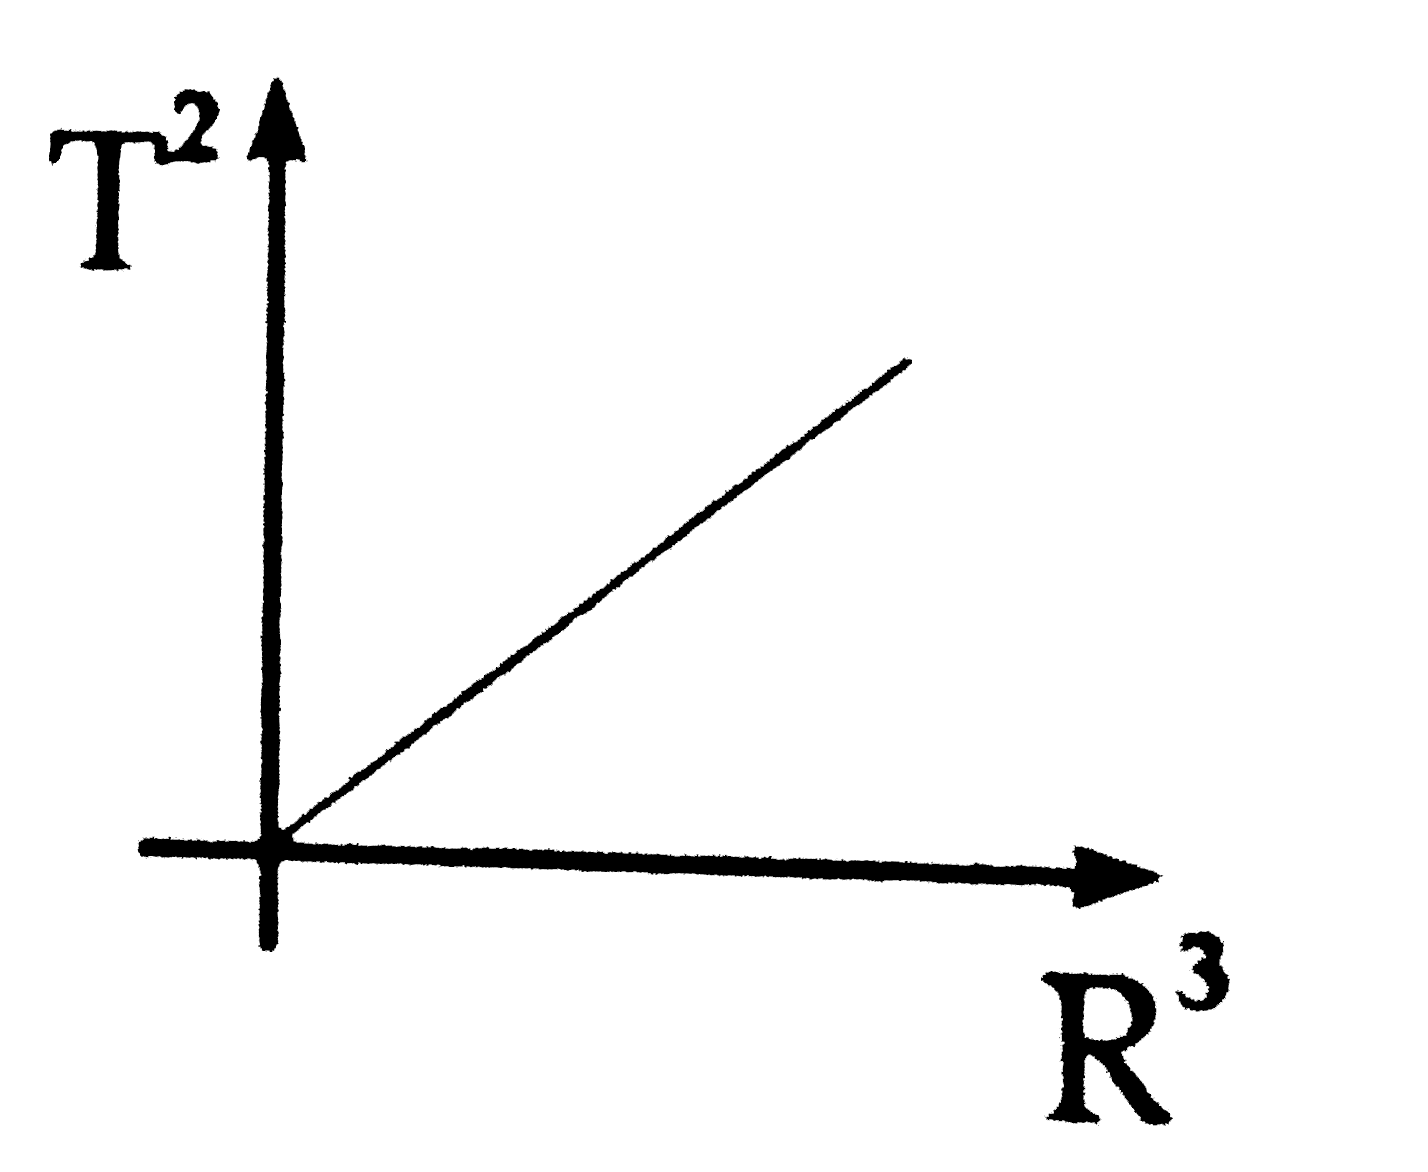 B
B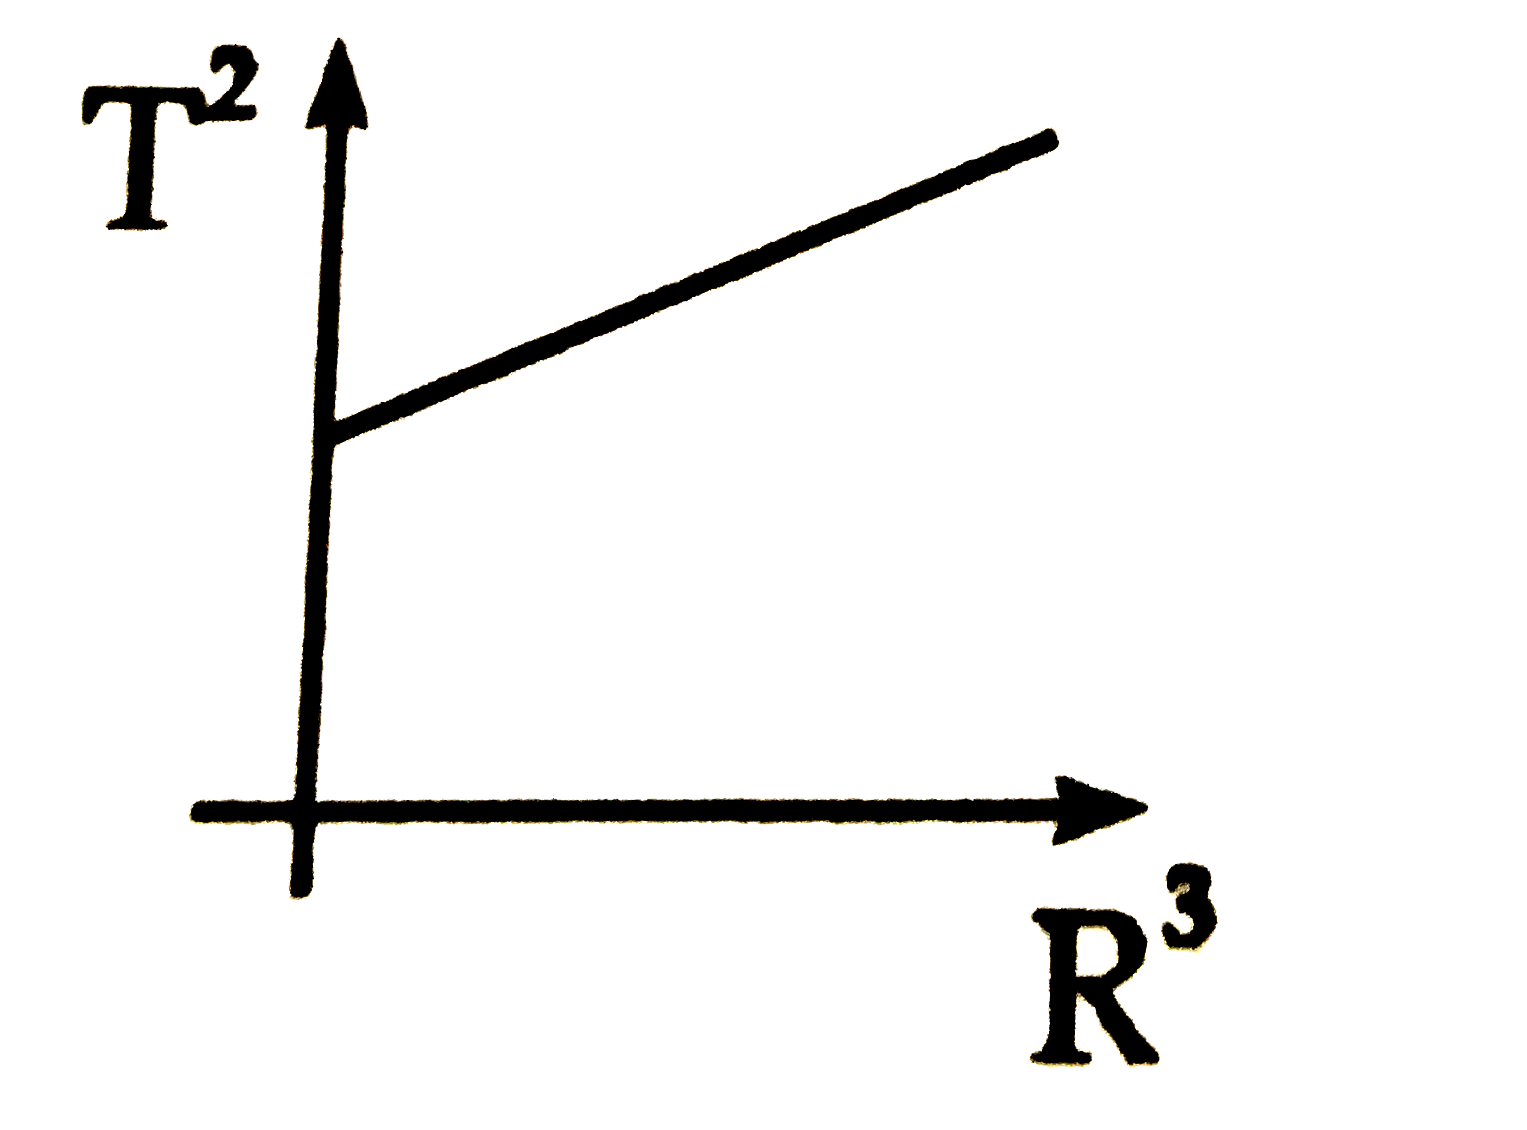 C
C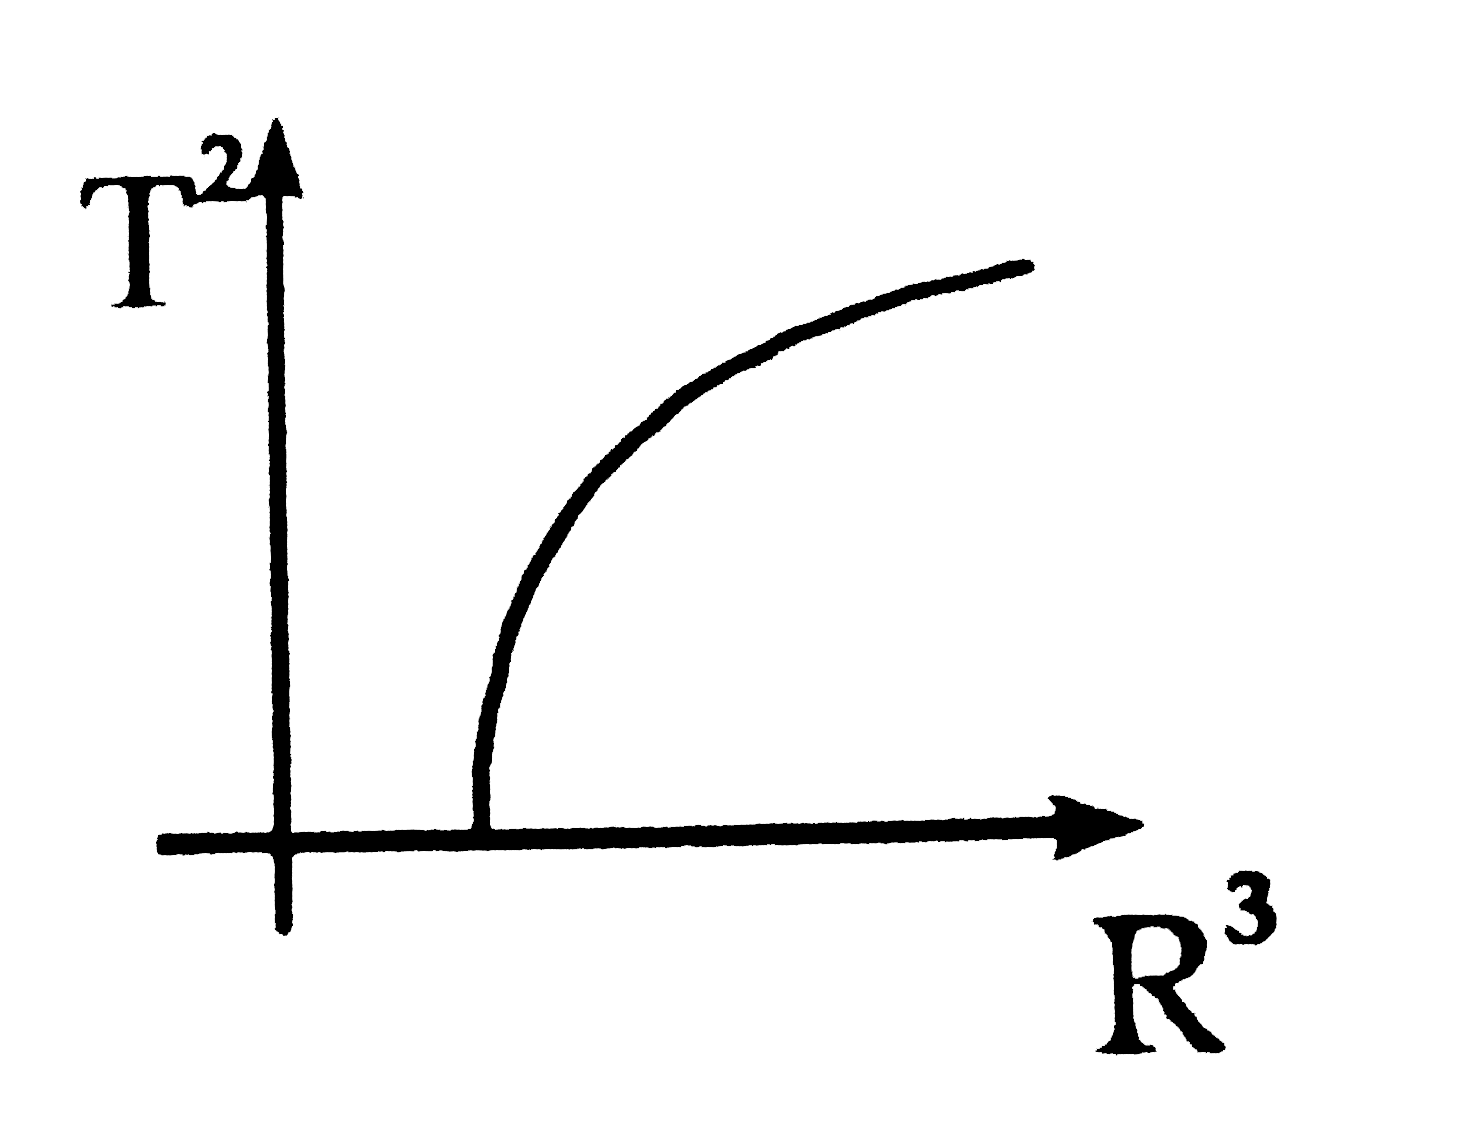 D
D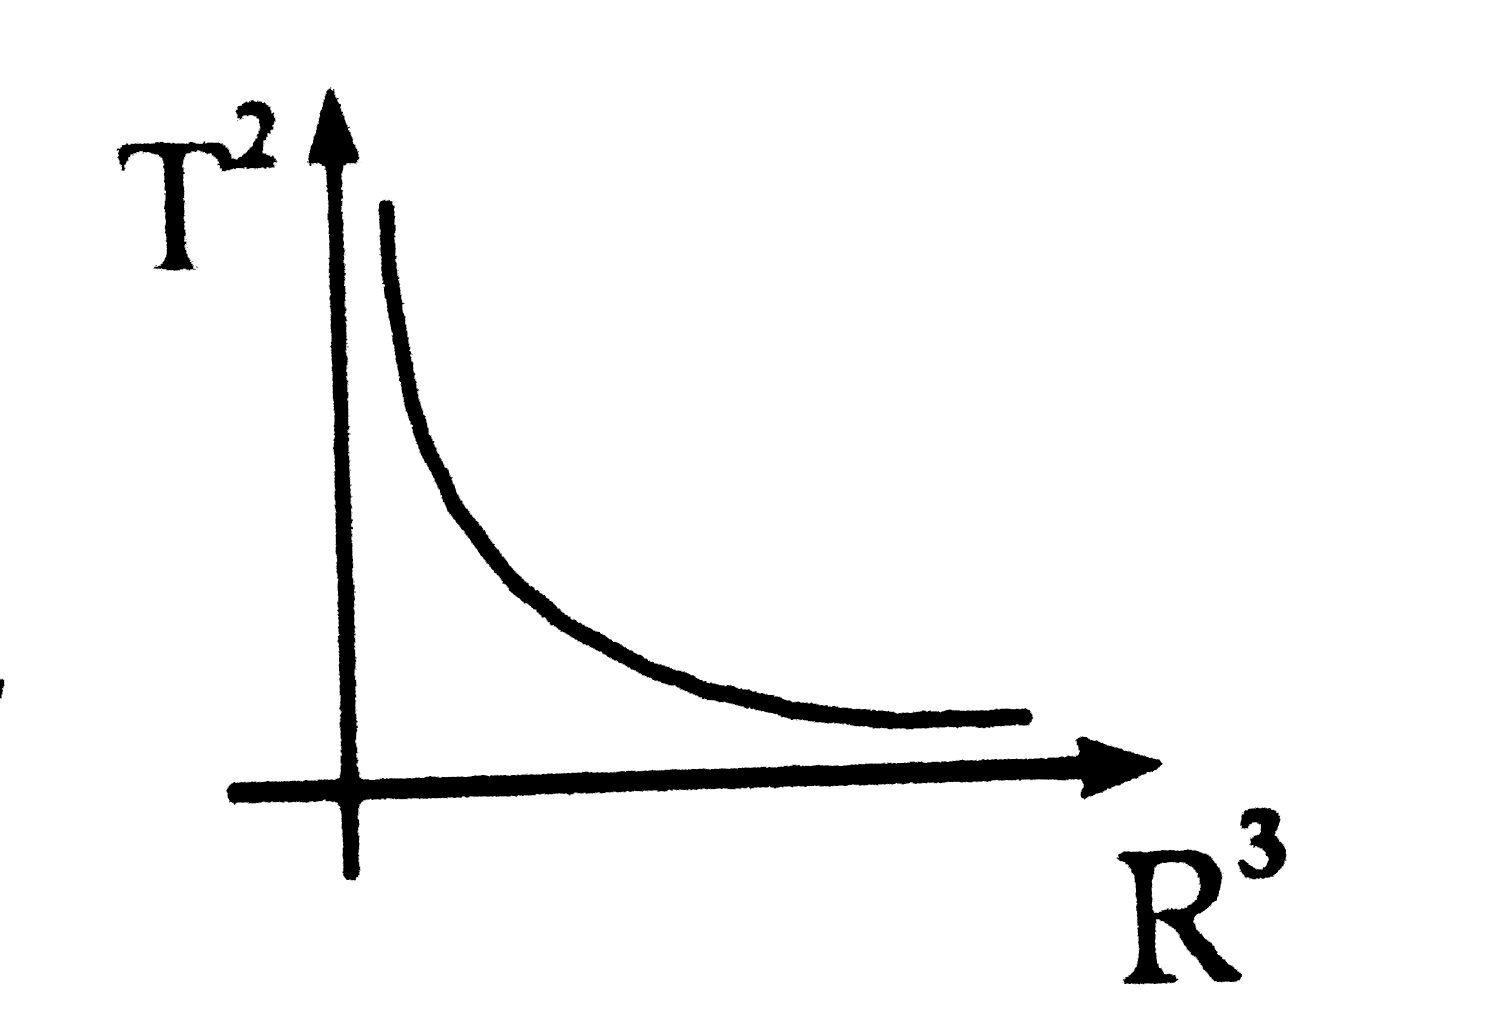
- Question 2 - Select One or More
Which of the following graphs represents zero order if
A→P
At t=0⇒[A]0
At t=t⇒[A]tA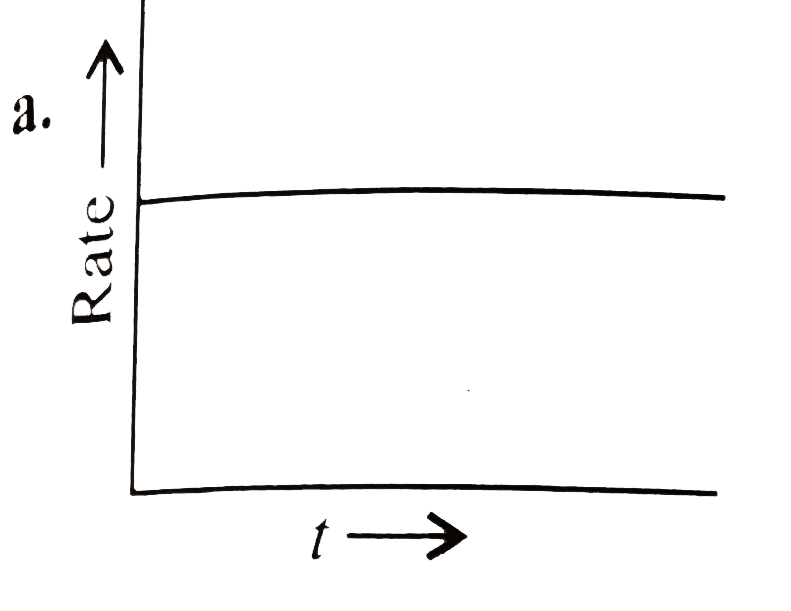 B
B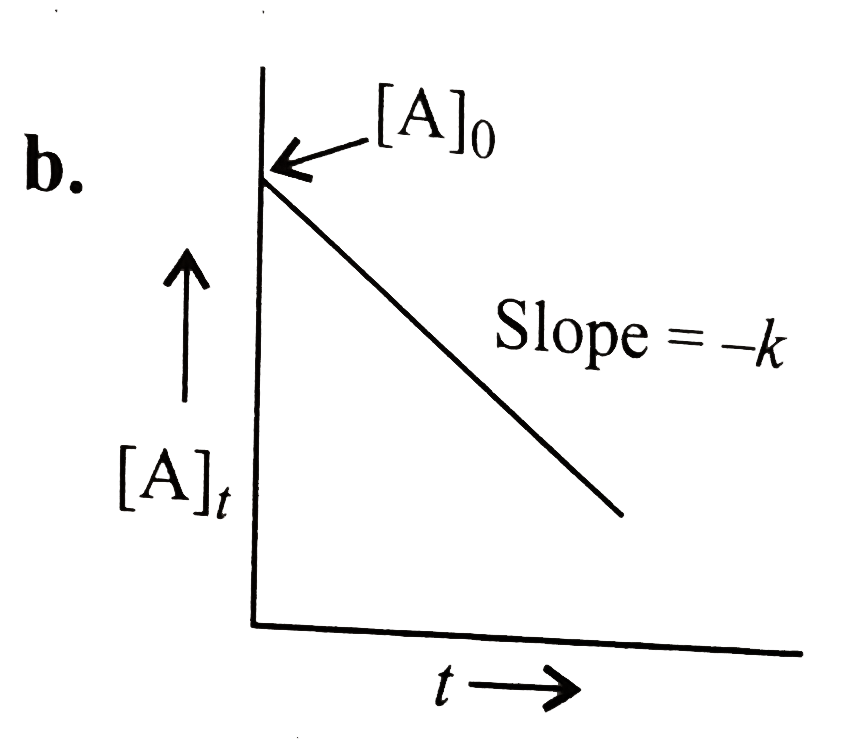 C
C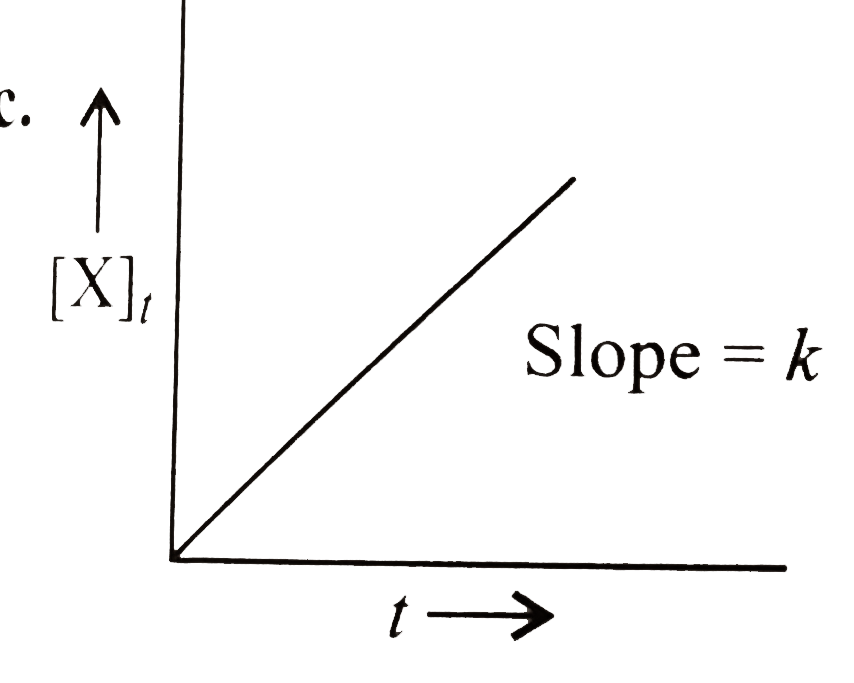 D
D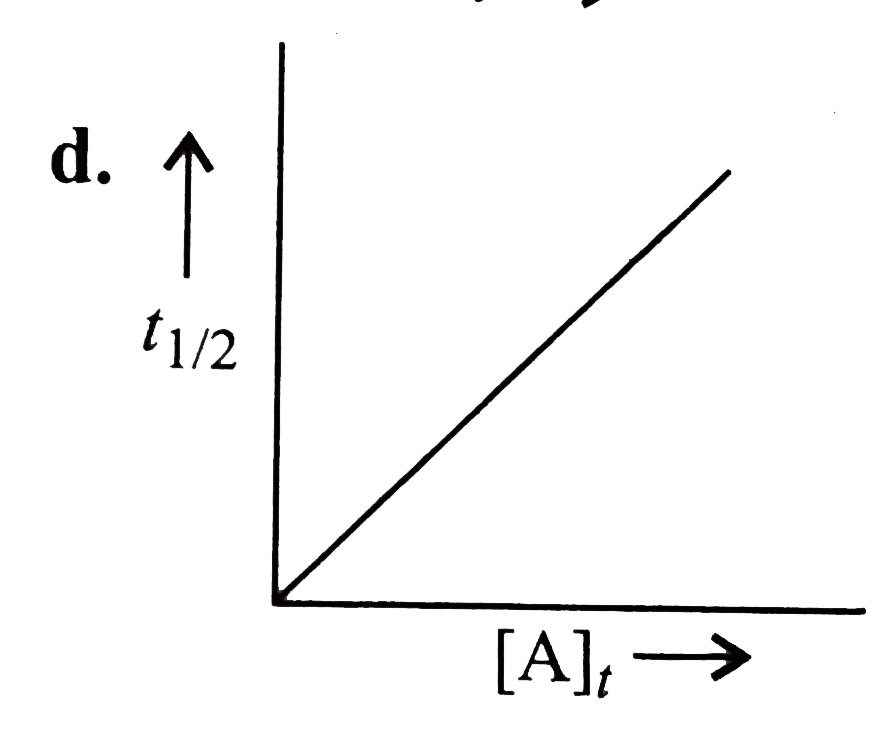
- Question 3 - Select One
Which of the following graphs show the v−t graph of a ball thrown upwards ?
A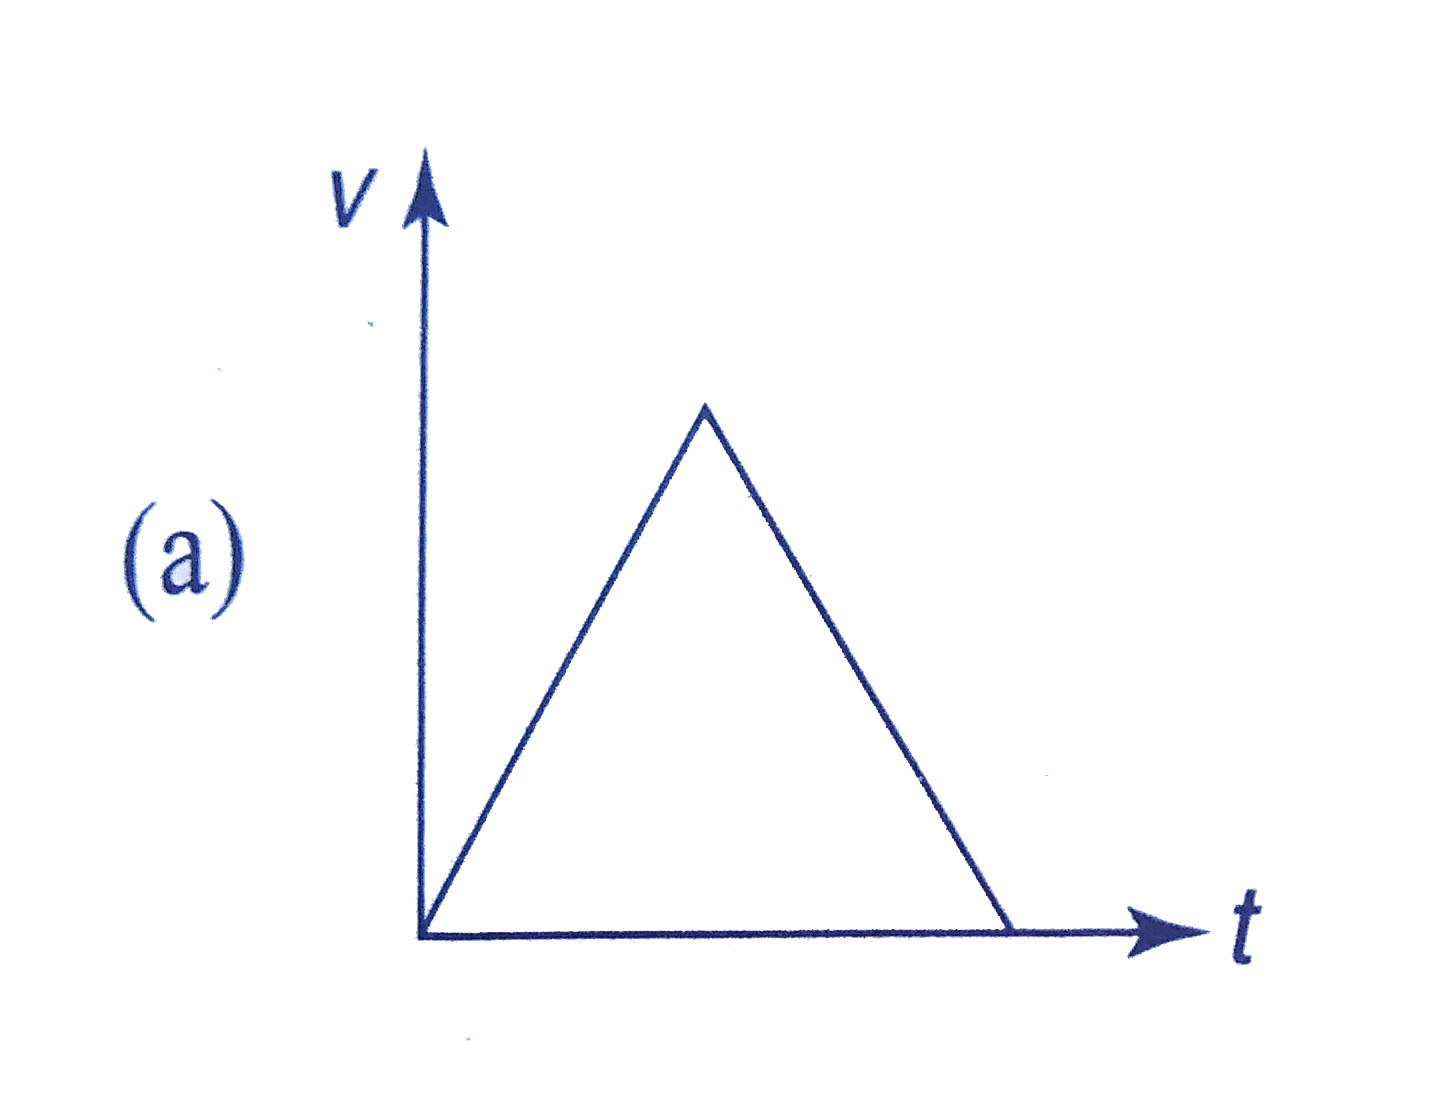 .B
.B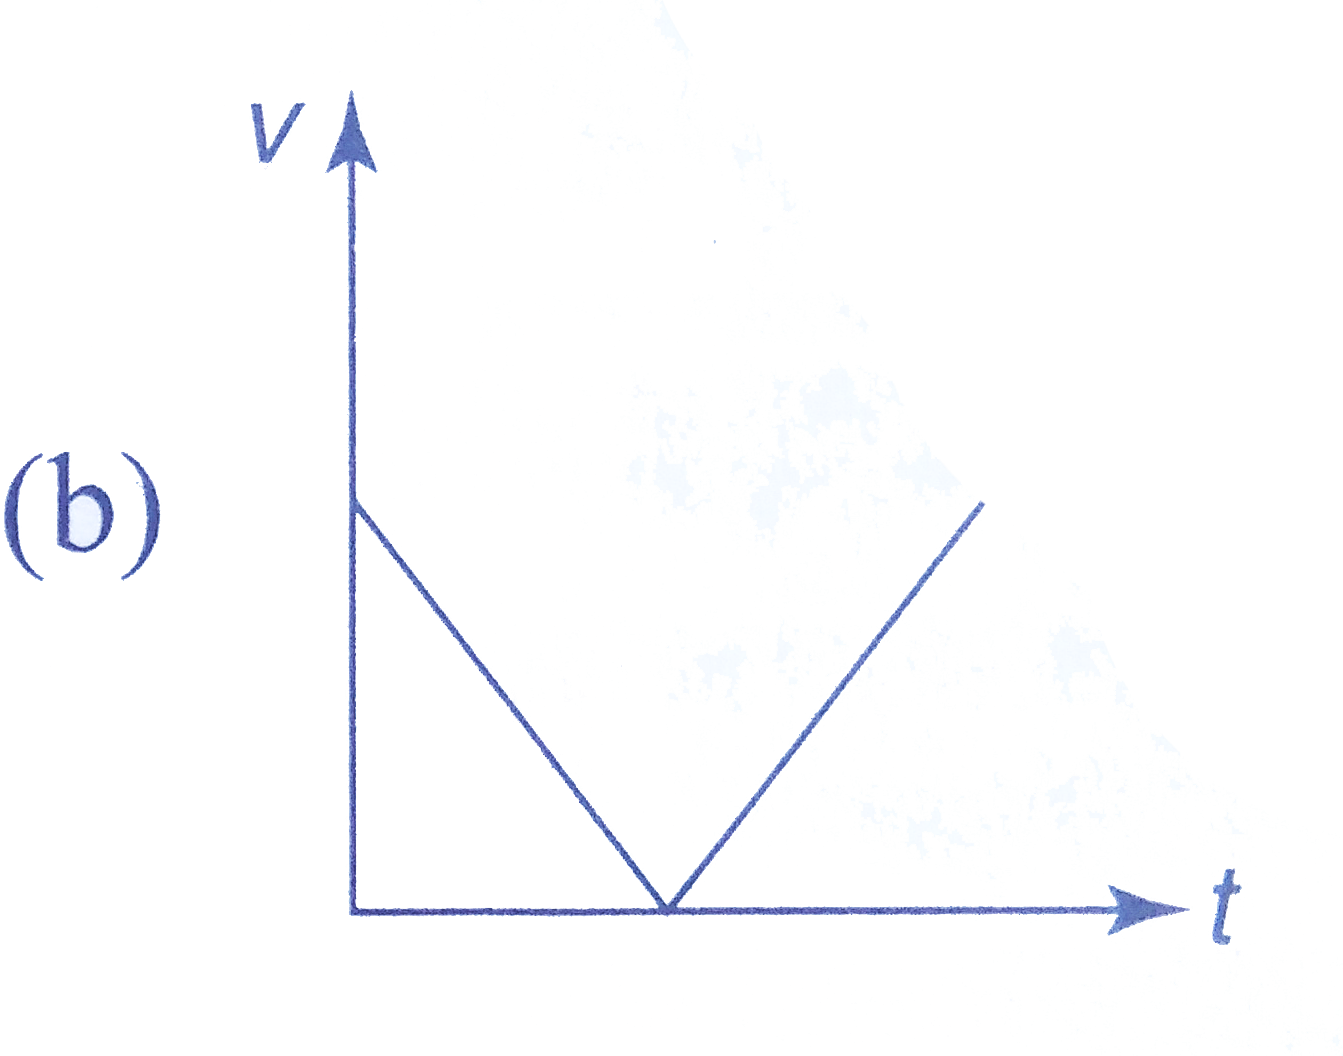 .C
.C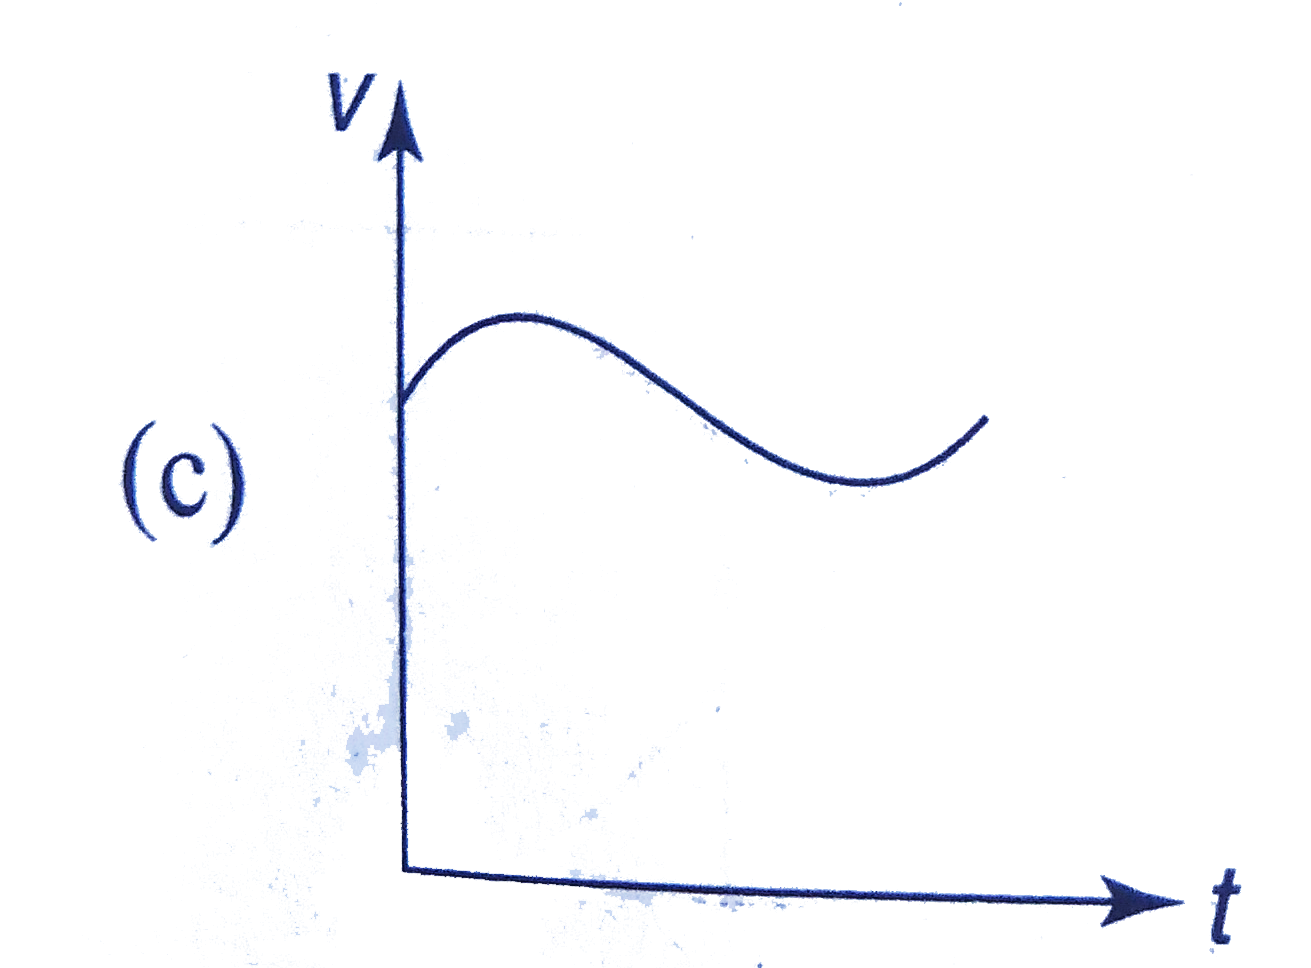 .D
.D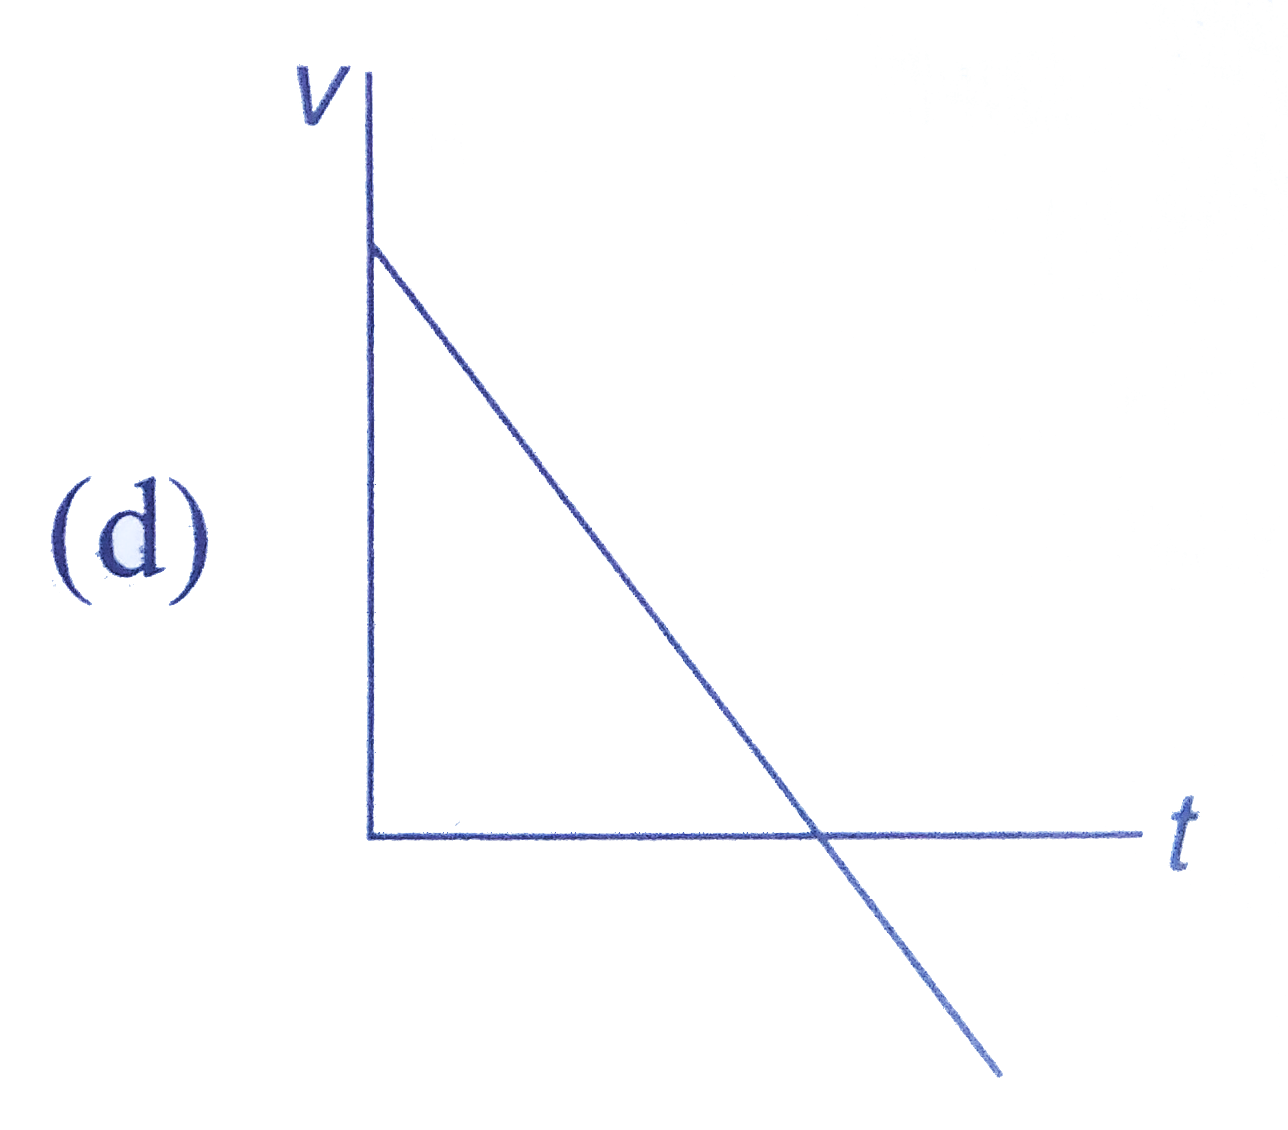 .
.
Which of the following graph(s) represent retardation ? [v : velocity, t : time, x : position]
View SolutionThe graph below shws the velocity versus time graph for a body
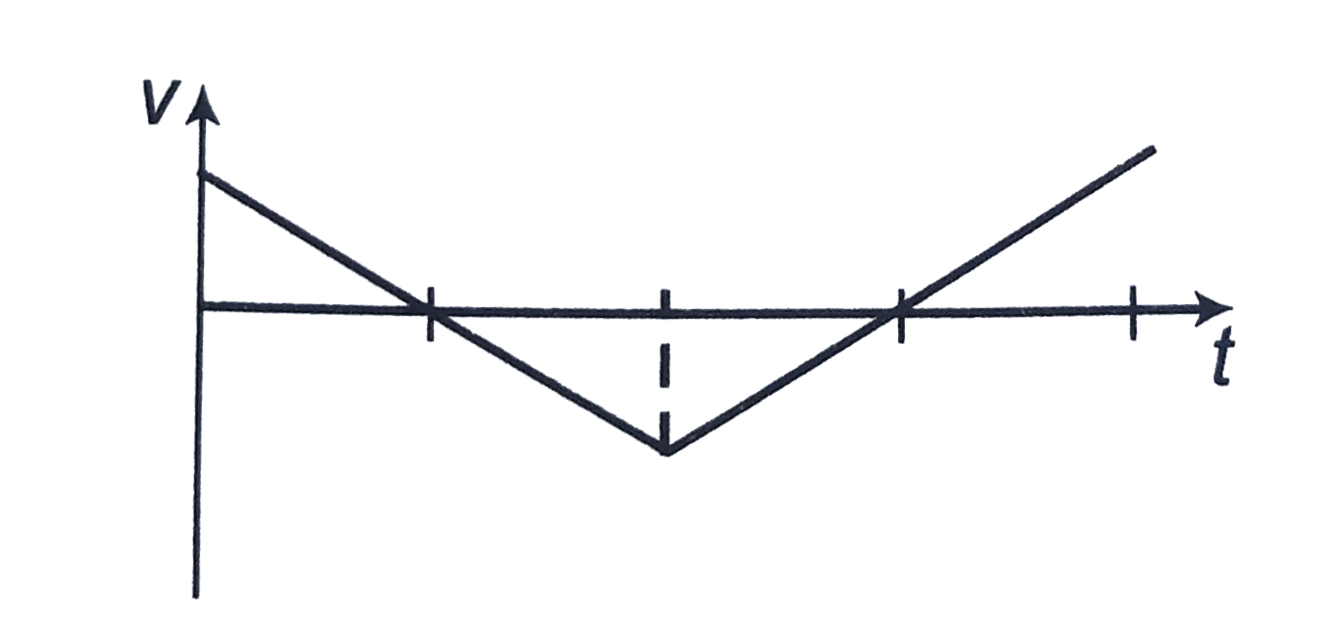
Which of the following graph represents the corresponding acceleration v//s time graph?View SolutionThe graph shown the variation with times t of the velocity v of an object . Which one of the following graphs best represents the variation of acceleration a of the object with time t?
 View Solution
Which of the following graph represents relation between the image position (v) and object position (u) from the concave lens.
View SolutionIf S, v and t respectively denote displacement, velocity and time, then which of the following graphs represents uniform motion?
View Solution

