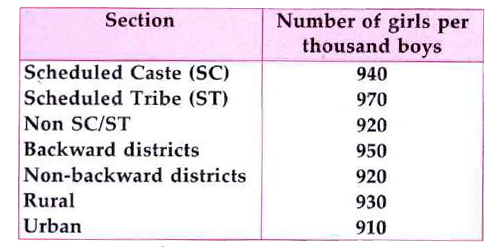
The following data on the number of girls (to the nearest ten) per thousand boys in different sections of Indian society is given below

Represent the information above by a bar graph.
The correct Answer is:(##MTGFOUCOUMATIXC14E01021_A01##)
Topper's Solved these Questions
- STATISTICSBOOK - MTG IIT JEE FOUNDATIONCHAPTER - STATISTICSEXERCISE - NCERT SECTION (Exercise 14.4)
7 Videos
- STATISTICSBOOK - MTG IIT JEE FOUNDATIONCHAPTER - STATISTICSEXERCISE - Exercise (Multiple Choice Question)
50 Videos
- STATISTICSBOOK - MTG IIT JEE FOUNDATIONCHAPTER - STATISTICSEXERCISE - NCERT SECTION (Exercise 14.2)
15 Videos
- QUADRILATERALS BOOK - MTG IIT JEE FOUNDATIONCHAPTER - QUADRILATERALS EXERCISE - Olympiad/HOTS CORNER
15 Videos
- TRIANGLESBOOK - MTG IIT JEE FOUNDATIONCHAPTER - TRIANGLESEXERCISE - OLYMPAID/ HOTS CORNER
10 Videos
Similar Questions
The following data on the number of girls (to the nearest ten) per thousand boys in different sections of Indian society is given below. Draw bar graph for the the data given below.
View SolutionThe number of hours spent by a school boy in different activities in a day is given below:

Represent the above information using pie diagram.
View SolutionThe number of hours spent by a school boy in different activities in a day is given below :

Represent the above information using a pie diagram.
View SolutionThe expenditure of a family of different heads in a month is given below

Draw a bar graph to represent the data above.
View SolutionThe expenditure of a family of different heads in a month is given below

Draw a bar graph to represent the data above.
View SolutionExpenditure on education of a country during a five years period (2002-2006), in crore of rupees, is given below

Represent the information above by a bar graph.
View SolutionExpenditure on education of a country during a five years period (2002-2006), in crore of rupees, is given below

Represent the information above by a bar graph.
View SolutionThe lengths in km (rounded to nearest hundred) of some major rivers of India is given below:

Draw a bar graph to represent the above information.
View SolutionThe following table shows the number of fruits in a fruit shop. Represent the above data by a bar graph
View SolutionIn a school, there are five sections of Class VI. The number of students in each section is given below:

Represent the above data using a bar graph.
View Solution
