The number of hours spent by a school boy in different activities in a day is given below :

Represent the above information using a pie diagram.
The correct Answer is:Measures of the central angles : 105∘,105∘,30∘,60∘,60∘.
Step by step video & image solution for The number of hours spent by a school boy in different activities in a day is given below : Represent the above information using a pie diagram. by Maths experts to help you in doubts & scoring excellent marks in Class 10 exams.
Updated on:21/07/2023Topper's Solved these Questions
- STATISTICSBOOK - NAVNEET PUBLICATION - MAHARASHTRA BOARDCHAPTER - STATISTICSEXERCISE - Challenging Questions
2 Videos
- SIMILARITYBOOK - NAVNEET PUBLICATION - MAHARASHTRA BOARDCHAPTER - SIMILARITYEXERCISE - SUBJECTIVE TYPE
20 Videos
- THEOREMS BOOK - NAVNEET PUBLICATION - MAHARASHTRA BOARDCHAPTER - THEOREMS EXERCISE - CIRCLE
15 Videos
Similar Questions
The number of hours spent by a school boy in different activities in a day is given below:

Represent the above information using pie diagram.
View SolutionThe number of hours, spent by a school boy on different activities in a working day, is given below: Activities, Sleep, School, Home, Play, others, Total No. Of hours, 8, 7, 4, 2, 3, 24 Present the information in the form of a pie-chart.
View Solution
Knowledge Check
A pie diagram represents the number of hours spent by a school boy in different activites in a day. If 7 hours are spent in school, then what is the measure of the central angle?
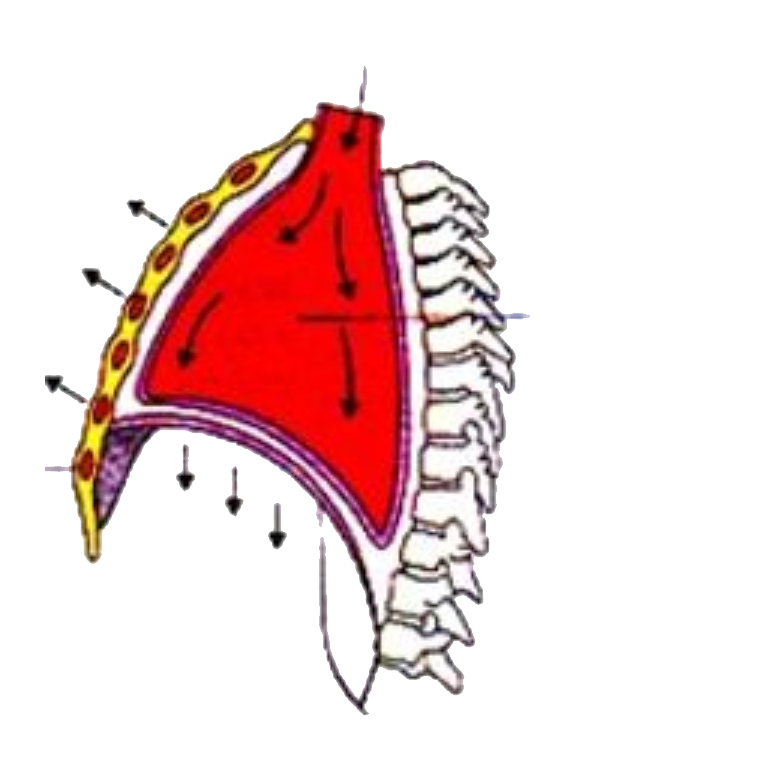
A210∘B105∘C52.5∘D90∘The diagram given below represents
 AinspirationBexpirationCSystoleDdiastole
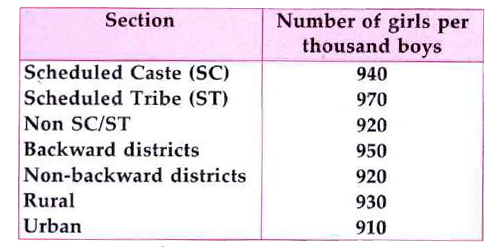
The following data on the number of girls (to the nearest ten) per thousand boys in different sections of Indian society is given below

Represent the information above by a bar graph.
View SolutionThe marks obtained by a student in an examination are given below :

Represent the data using a pie diagram.
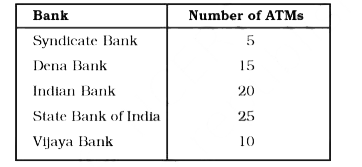
View SolutionThe number of ATMs of different banks in a city is shown below:

Draw a bar graph to represent the above information by choosing the scale of your choice.
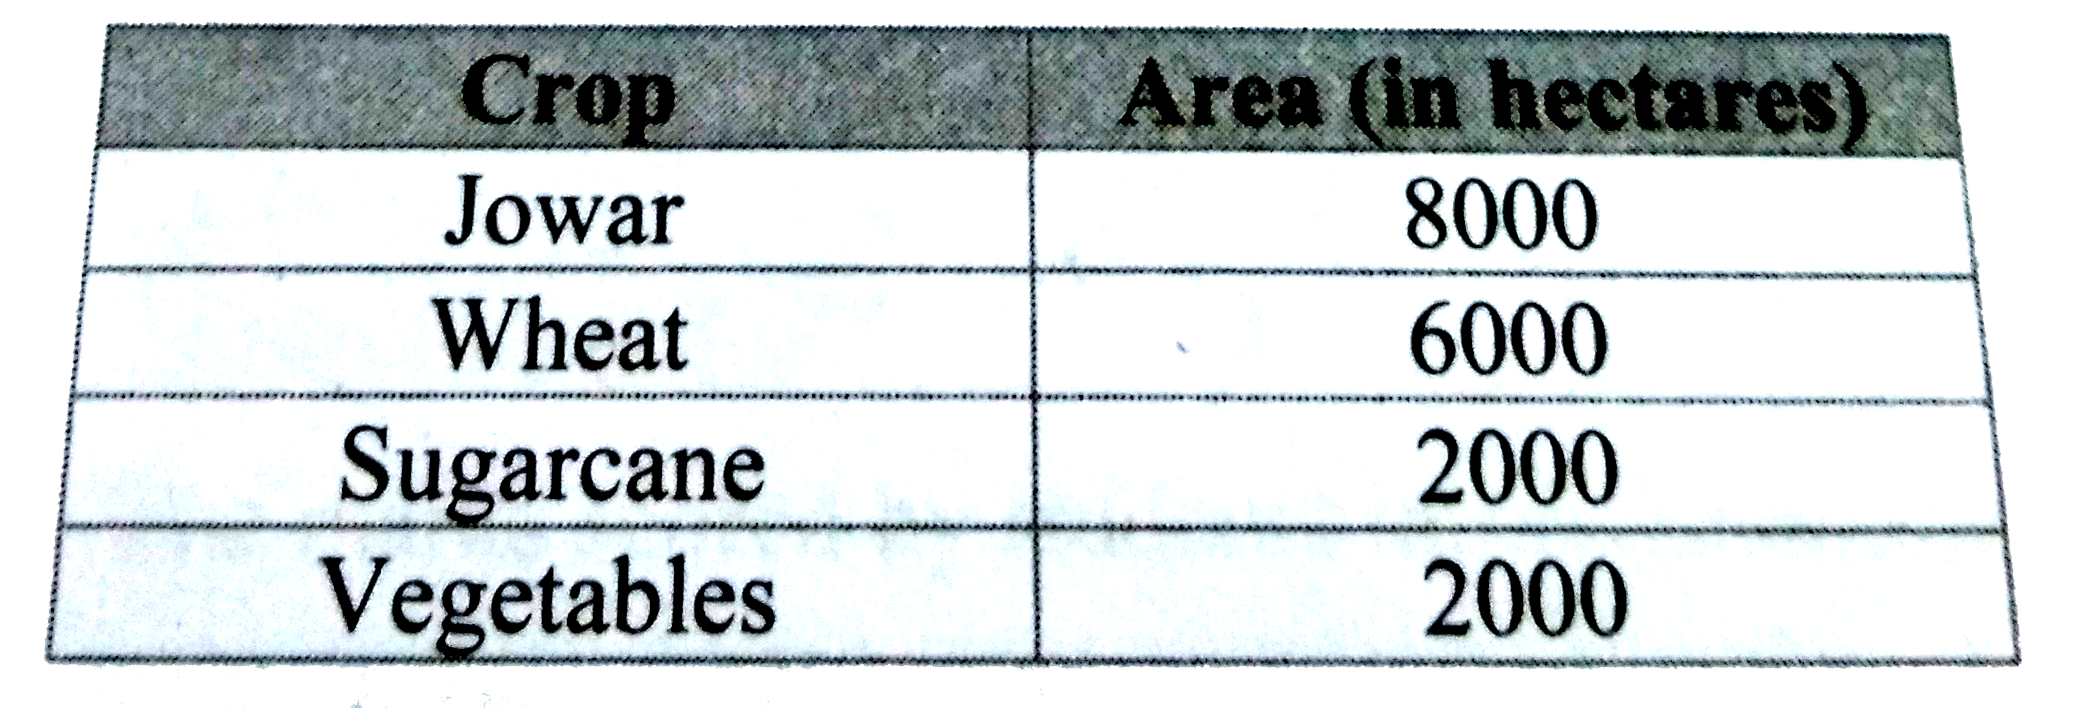
View SolutionArea under different crops n a certain village is given below : Represent, it by a pie diagram:

View SolutionArea under different crops in a certain village is given below. Represent it by a pie diagram:

View SolutionArea under different crops n a certain village is given below : Represent, it by a pie diagram:

View Solution
