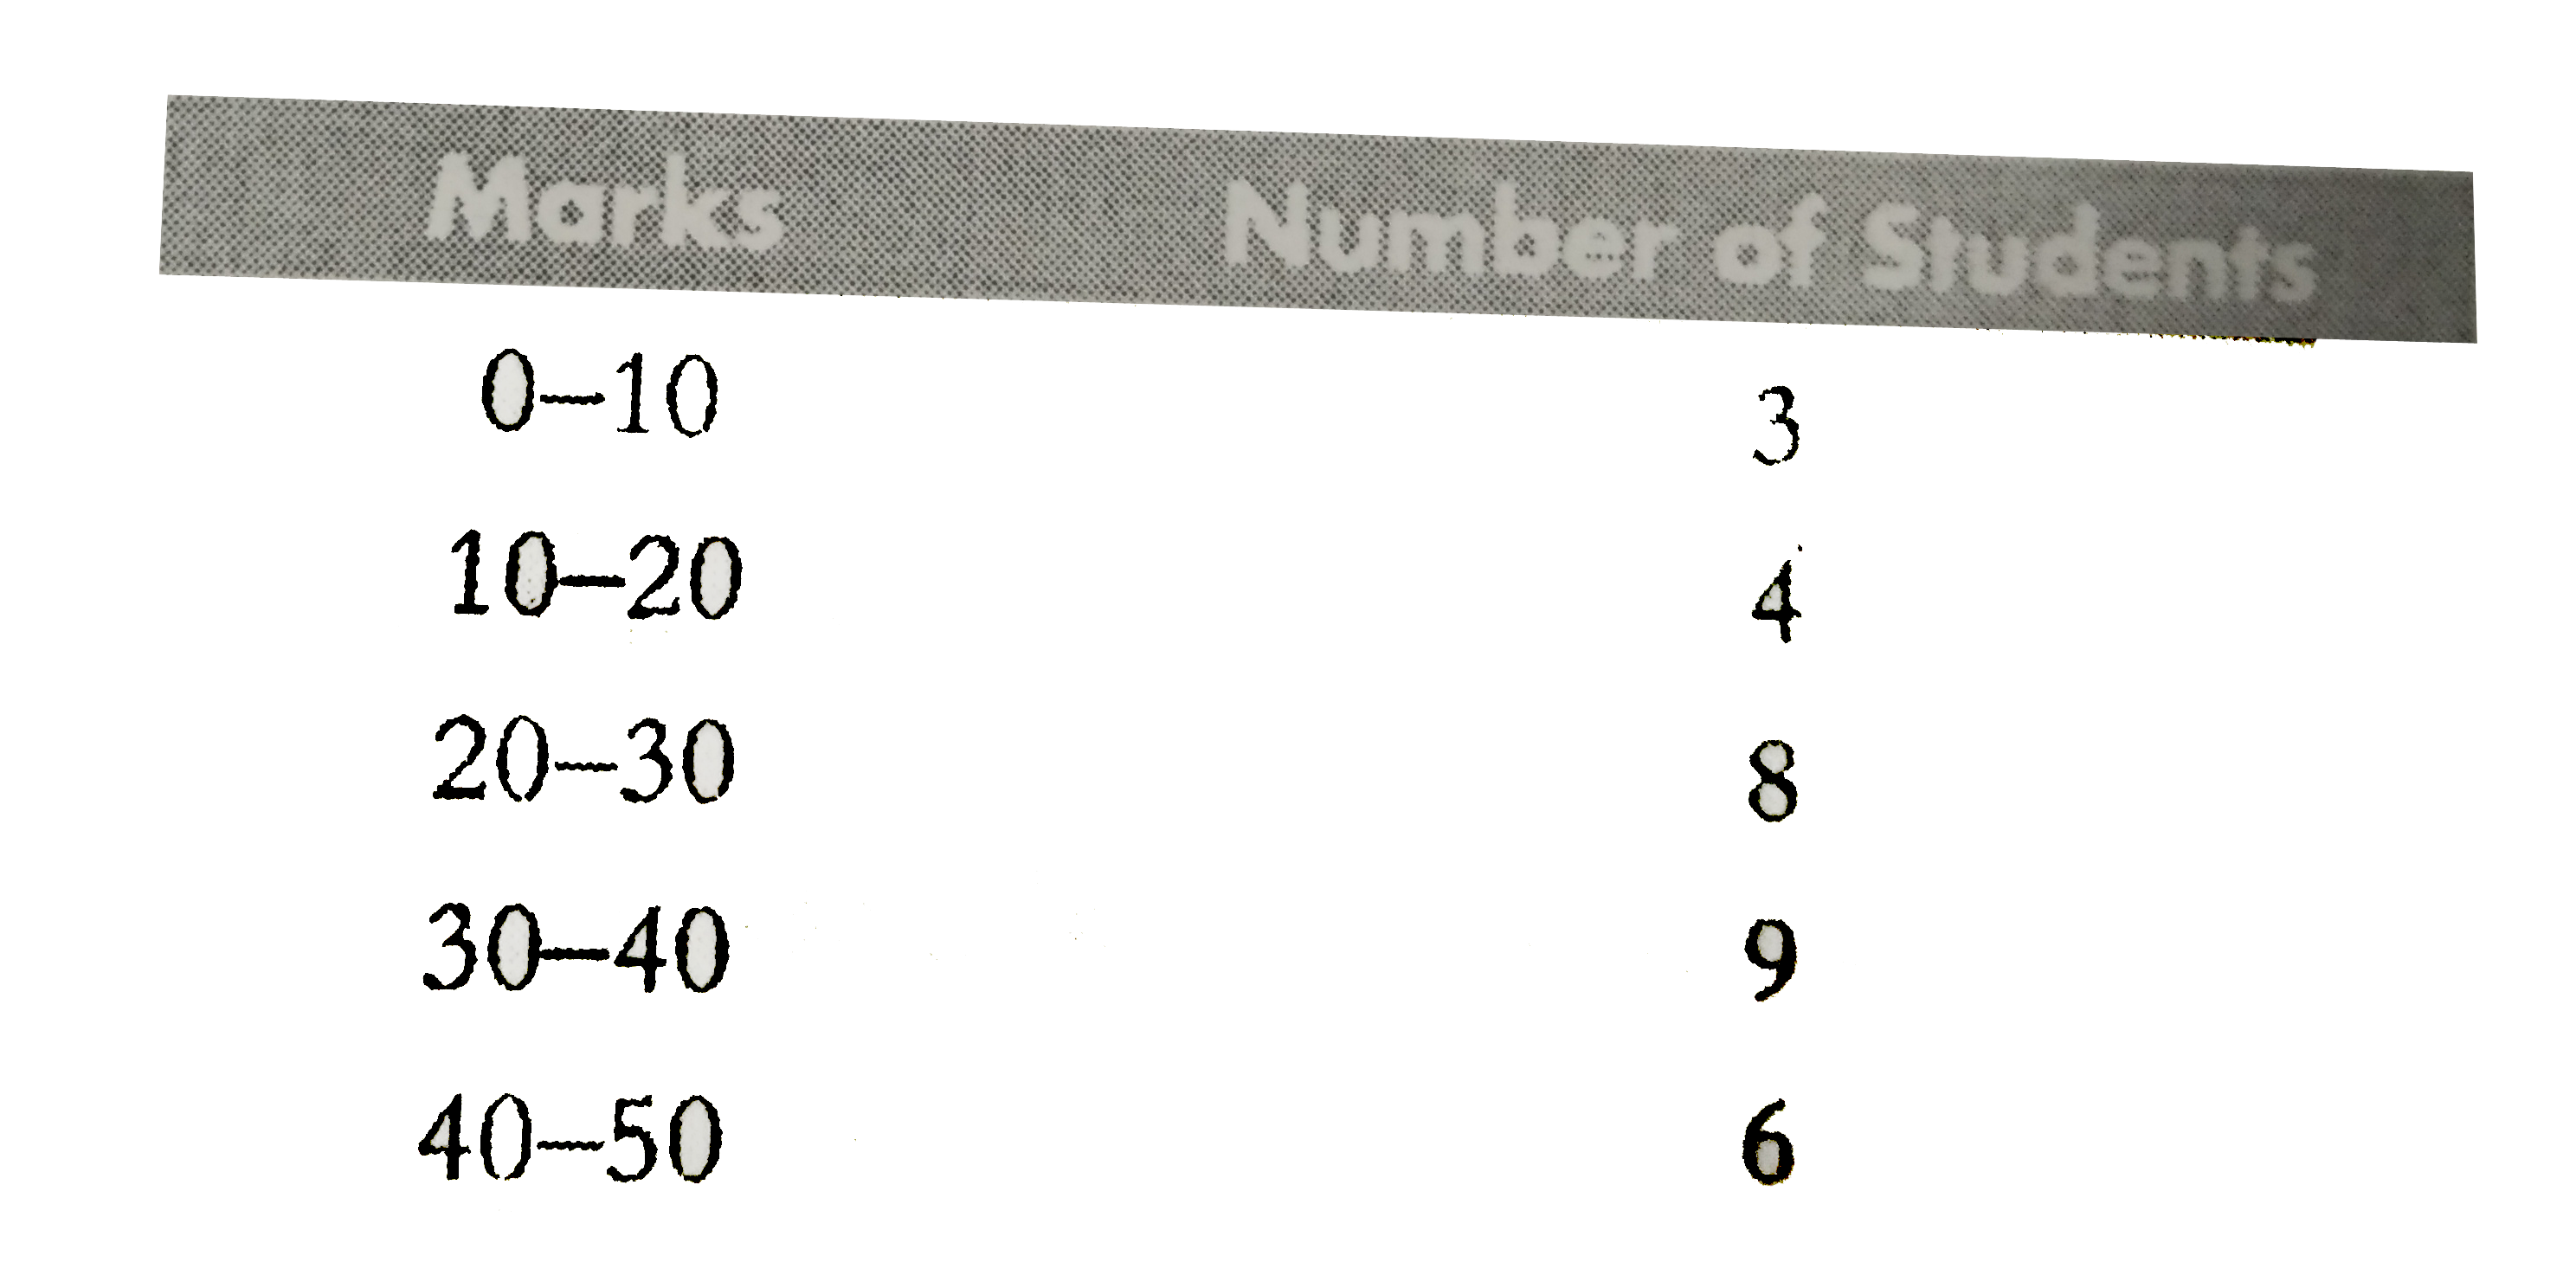
Draw the histogram of distribution

The correct Answer is:(##MTGFOUCOUMATIXC14E02082_A01##)
Step by step video, text & image solution for Draw the histogram of distribution by Maths experts to help you in doubts & scoring excellent marks in Class 9 exams.
Updated on:21/07/2023Topper's Solved these Questions
- STATISTICSBOOK - MTG IIT JEE FOUNDATIONCHAPTER - STATISTICSEXERCISE - Exercise ( Subjective Problems ) ( Long Answer Type )
6 Videos
- STATISTICSBOOK - MTG IIT JEE FOUNDATIONCHAPTER - STATISTICSEXERCISE - Exercise ( Integer/Numerical Value Type )
10 Videos
- STATISTICSBOOK - MTG IIT JEE FOUNDATIONCHAPTER - STATISTICSEXERCISE - Exercise ( Subjective Problems ) (Very Short Answer Type )
10 Videos
- QUADRILATERALS BOOK - MTG IIT JEE FOUNDATIONCHAPTER - QUADRILATERALS EXERCISE - Olympiad/HOTS CORNER
15 Videos
- TRIANGLESBOOK - MTG IIT JEE FOUNDATIONCHAPTER - TRIANGLESEXERCISE - OLYMPAID/ HOTS CORNER
10 Videos
Similar Questions
Calculate P ( r ) for r = 1, 2, 3, 4 and 5 by using the recurrence formula of the binomial distribution for the following Hence, draw the histogram for the distribution :
(i) p=13,n=5 (ii) p=16,n=5.
View SolutionA discrete random variable 'X' has mean equal to 3 and variance equal to 2. Assuming that the underlying distribution of 'X' is binomial, find the distribution and hence obtain :
(i) P(X = 0)
(ii) Draw a histogram for the distribution.
View Solution
Knowledge Check
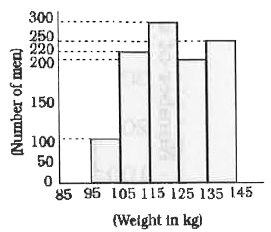
Study the histogram of weight distribution of different men and answer question based on it.

Average number of men per interval who particular in this survey isA200B180C214D194Histogram is a
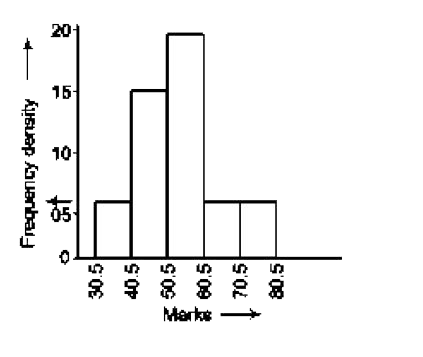
AOne dimensional figure,BTwo dimensional figureCMultidimensional figureDThree dimensional figure.The following histogram shows the distribution of marks of 50 students in a collegeThe average marks of the students, number is
 A43.5B44.5C45.5D74.7
In a hypothetical sample of 20 people the amounts of money with them were found to be as follows: 114,108,100,98,101,109,117,119,126,131,136,143,156, 169,182,195,207,219,235,118. Draw the histogram of the frequency distribution (taking one of the class intervals as 50-100)
View SolutionDrawing the histogram of a continuous grouped frequency distribution.
View SolutionDraw a line sketch of distribution of water on earth's surface.
View SolutionDraw the histogram for the following distribution :

View SolutionDraw the histogram for the following frequency distribution :

View Solution