Drawing the histogram of a continuous grouped frequency distribution.
Step by step video & image solution for Drawing the histogram of a continuous grouped frequency distribution. by Maths experts to help you in doubts & scoring excellent marks in Class 8 exams.
Updated on:21/07/2023Similar Questions
Continuous or grouped frequency distribution.
View SolutionConstruction of Histogram of a Continuous grouped frequency distribution
View SolutionConstruction of Histogram of a Continuous grouped frequency distribution with unequal distribution
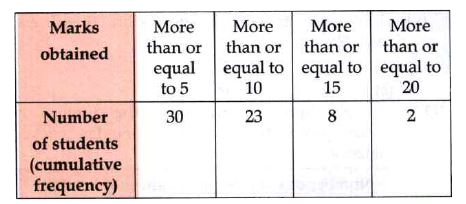
View SolutionFollowing distribution gives cumulative frequencies of 'more than type':
Change the above data to a continuous grouped frequency distribution.

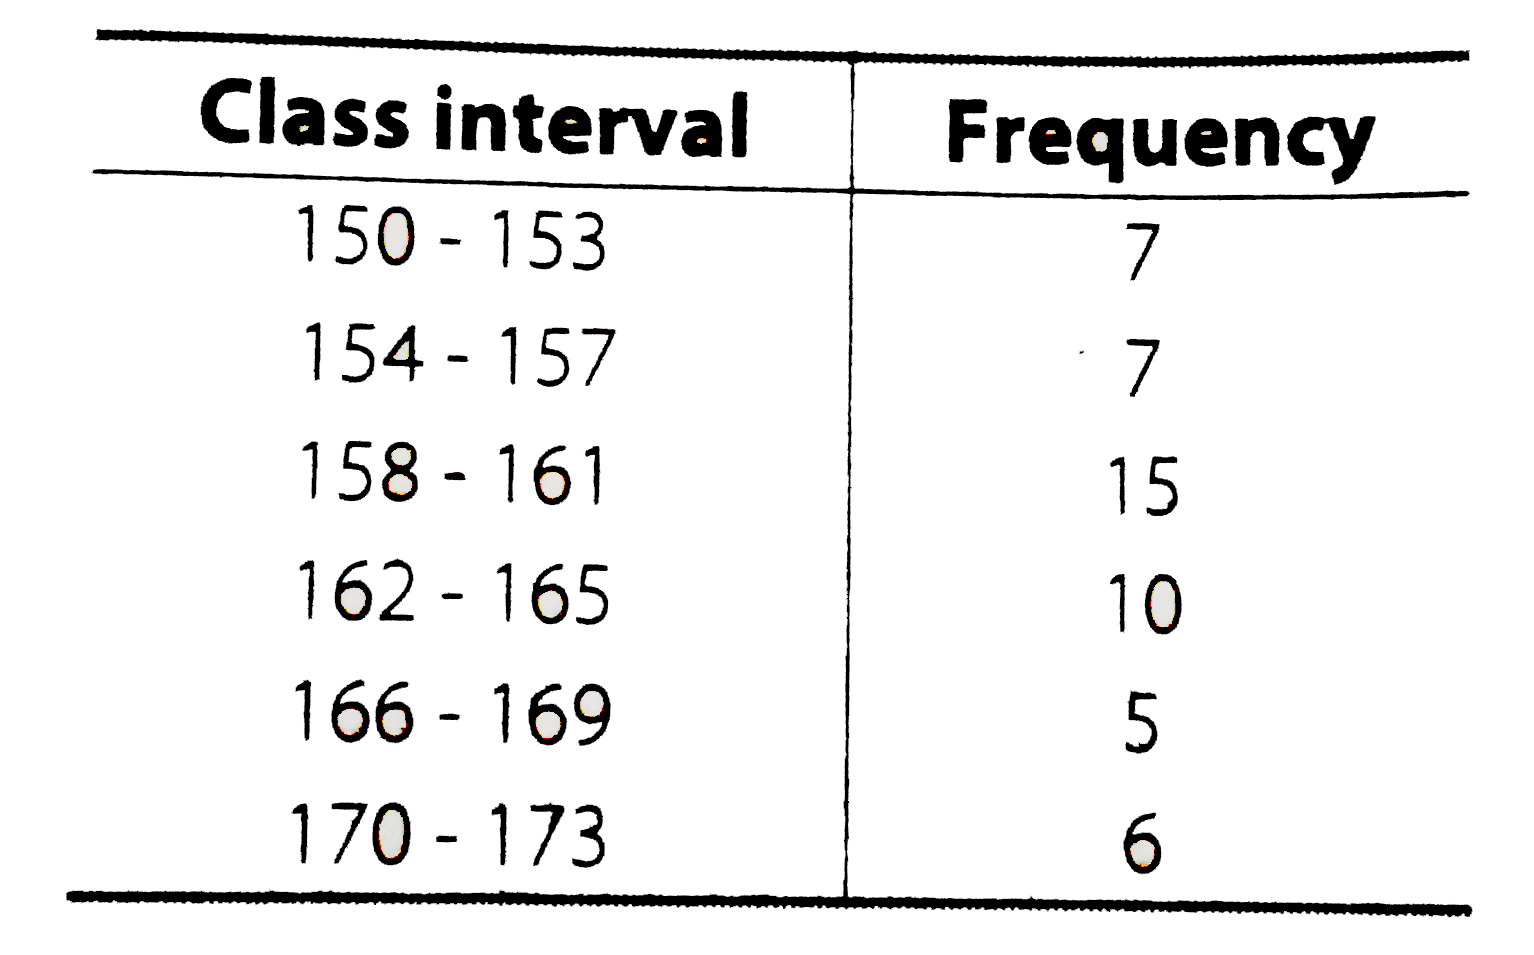
View SolutionConvert the given frequency distribution into a continuouos grouped frequency distribution.

In which intervals would 153.5 and 157.5 be included?
View SolutionArithmetic mean of a continuous frequency distribution
View SolutionConstruction of a Grouped frequency distribution
View SolutionDraw the histogram for the following frequency distribution :

View SolutionDraw the histogram of distribution

View SolutionFor the given frequency polygon make a continuous grouped frequency distribution table and hence find the mean.
View Solution
