The given bar graph shows the sale of different brands of shirts in a shop in one month.
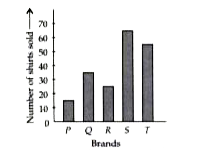
(i) How many total shirts are sold in the month ?
The correct Answer is:d
Step by step video & image solution for The given bar graph shows the sale of different brands of shirts in a shop in one month. (i) How many total shirts are sold in the month ? by Maths experts to help you in doubts & scoring excellent marks in Class 6 exams.
Updated on:21/07/2023Topper's Solved these Questions
- DATA HANDLING BOOK - MTG IIT JEE FOUNDATIONCHAPTER - DATA HANDLING EXERCISE - Exercise (Subjective Problems (Integer/Numerical Value Type )
10 Videos
- BASIC GEOMETRICAL IDEASBOOK - MTG IIT JEE FOUNDATIONCHAPTER - BASIC GEOMETRICAL IDEASEXERCISE - OLYMPIAD/HOTS CORNER
10 Videos
- DECIMALSBOOK - MTG IIT JEE FOUNDATIONCHAPTER - DECIMALSEXERCISE - OLYMPIAD/HOTS CORNER
20 Videos
Similar Questions
The given bar graph shows the sale of different brands of shirts in a shop in one month.

Find the ratio of number of shirts sold of brand S to the number of shirts sold or brand P and R together.
{ ((a),8:9),((b)13:8),((c )11:7),((d)13:6): }
View SolutionThe given bar graph represents the sale of cars in five different states in a month.
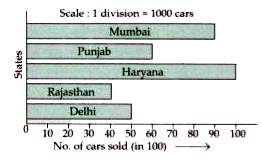
Which state sold 5000 cars ?
View Solution
Knowledge Check
The bar graph shows 1 month's sales of different brands of washing machines of a certain electronics store in Rs. 1000s. Study the diagram and answer the following questions.
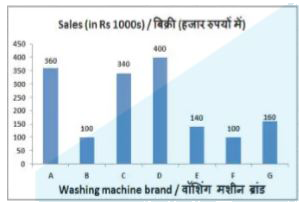
What is the ratio of sales of brand G to that of brand A?A9:4B1:2C2:1D4:9The bar graph shows 1 month's sales figures of different brands of washing machines of a certain electronics store in Rs 1000s. Study the diagram and answer the following questions.
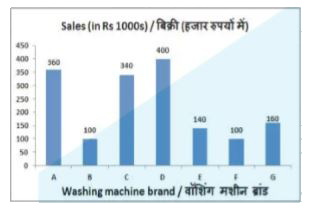
Sales of brand D was greater than that of brand B by ________.A300%B75%C100%D200%The bar graph shows 1 month's sales figures of different brands of washing machines of a certain electronics store in Rs 1000s. Study the diagram and answer the following questions.
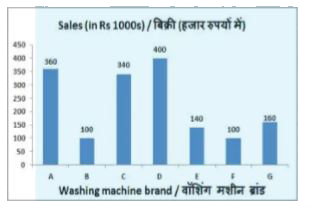
Sales of which washing machine brand were the second highest?AGBDCCDA
The given pictograph shows the sale of houses by a property dealer in different months.
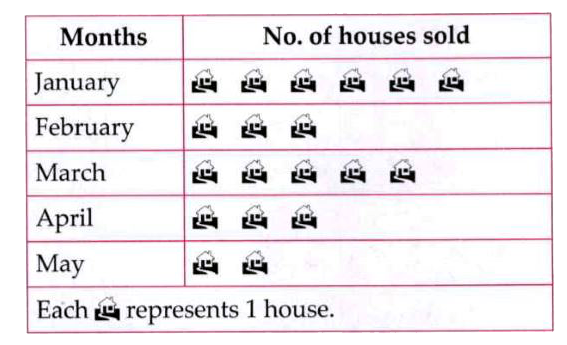
How many houses did the dealer sold in February and March altogether ?
View SolutionThe bar graph shows the number of cars of different brands sold by a dealer in a month. Study the diagram and answer the following question.
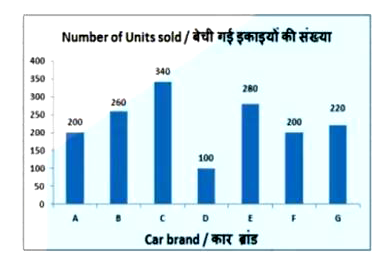
What is the ratio of units sold of brand G to that of brand E?
View SolutionThe bar graph shows the number of cars of different brands sold by a dealer in a month. Study the diagram and answer the following questions.
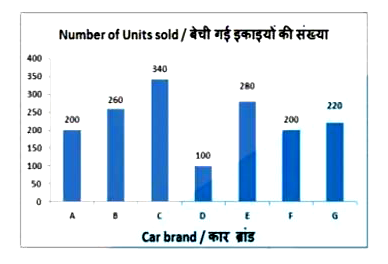
Units sold of brand D was lesser than that of brand F by _______.
View SolutionThe bar graph shows the number of cars of different brands sold by a dealer in a month, Study the diagram and answer the following question.
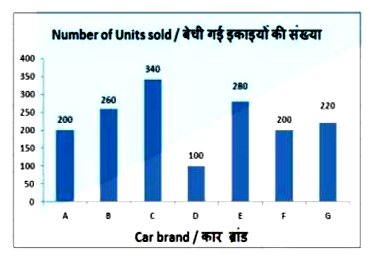
If the average price of a car sold by the dealer is Rs 5 lakhs then what is the sales (in Rs lakhs) of all the cars sold by the dealer in the month?
View SolutionThe bar graph shows the number of cars of different brands sold by a dealer in a month. Study the diagram and answer the following question.
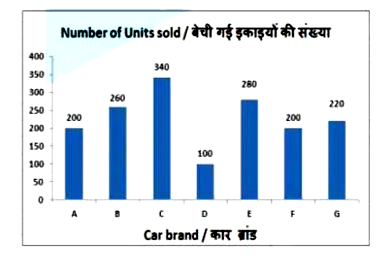
Units sold of which car brand were the second highest?
View Solution
