Given below is the pictorial representation of various kind of apples in a food store which were sold.
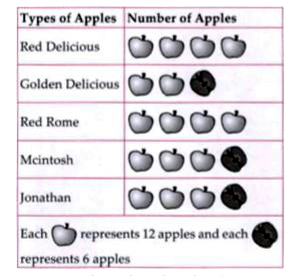
What is the total number of apples sold for golden delicious and Jonathan varieties ?
The correct Answer is:72
Step by step video & image solution for Given below is the pictorial representation of various kind of apples in a food store which were sold. What is the total number of apples sold for golden delicious and Jonathan varieties ? by Maths experts to help you in doubts & scoring excellent marks in Class 6 exams.
Updated on:21/07/2023Topper's Solved these Questions
- DATA HANDLING BOOK - MTG IIT JEE FOUNDATIONCHAPTER - DATA HANDLING EXERCISE - Exercise (Subjective Problems (Long Answer Type)
10 Videos
- DATA HANDLING BOOK - MTG IIT JEE FOUNDATIONCHAPTER - DATA HANDLING EXERCISE - Exercise (Subjective Problems (Integer/Numerical Value Type )
10 Videos
- DATA HANDLING BOOK - MTG IIT JEE FOUNDATIONCHAPTER - DATA HANDLING EXERCISE - Exercise (Subjective Problems (Very Short Answer Type))
9 Videos
- BASIC GEOMETRICAL IDEASBOOK - MTG IIT JEE FOUNDATIONCHAPTER - BASIC GEOMETRICAL IDEASEXERCISE - OLYMPIAD/HOTS CORNER
10 Videos
- DECIMALSBOOK - MTG IIT JEE FOUNDATIONCHAPTER - DECIMALSEXERCISE - OLYMPIAD/HOTS CORNER
20 Videos
Similar Questions
Given below is the pictorial representation of various kind of apples in a food store which were sold.
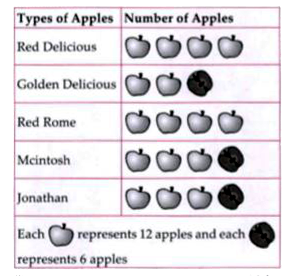
How many apples were sold of Mcintosh variety ?
View SolutionGiven below is the number of pairs of shoes of different sizes sold in a day by the owner of a shop
What is the modal shoe-size

View Solution
Knowledge Check
The pie chart given below shows sale of different types of cars in a city for a given year. The total sale of cars in the city is 600000.
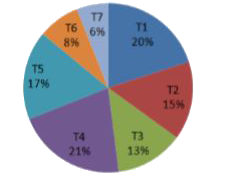
What is the sum of total number of cars sold of type T5, T6 and T3?A232000B228000C245000D252000The Bar graph given below presents the number of books sold by a bookseller during different months of a year.
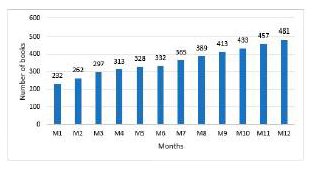
What is the total number of books sold by the bookseller in the year?A4032B4132C4302D4202The given pie-chart shows the distribution (in degrees) of cars sold of difference models by a company in 2015-16.
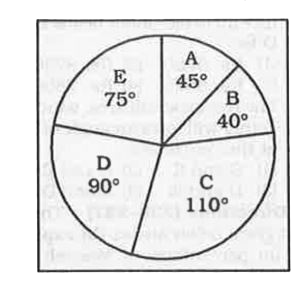
If 5% of the total number of cars sold of model E is 750, then what is the average number of cars sold of all the models ?A15000B14400C16800D14000
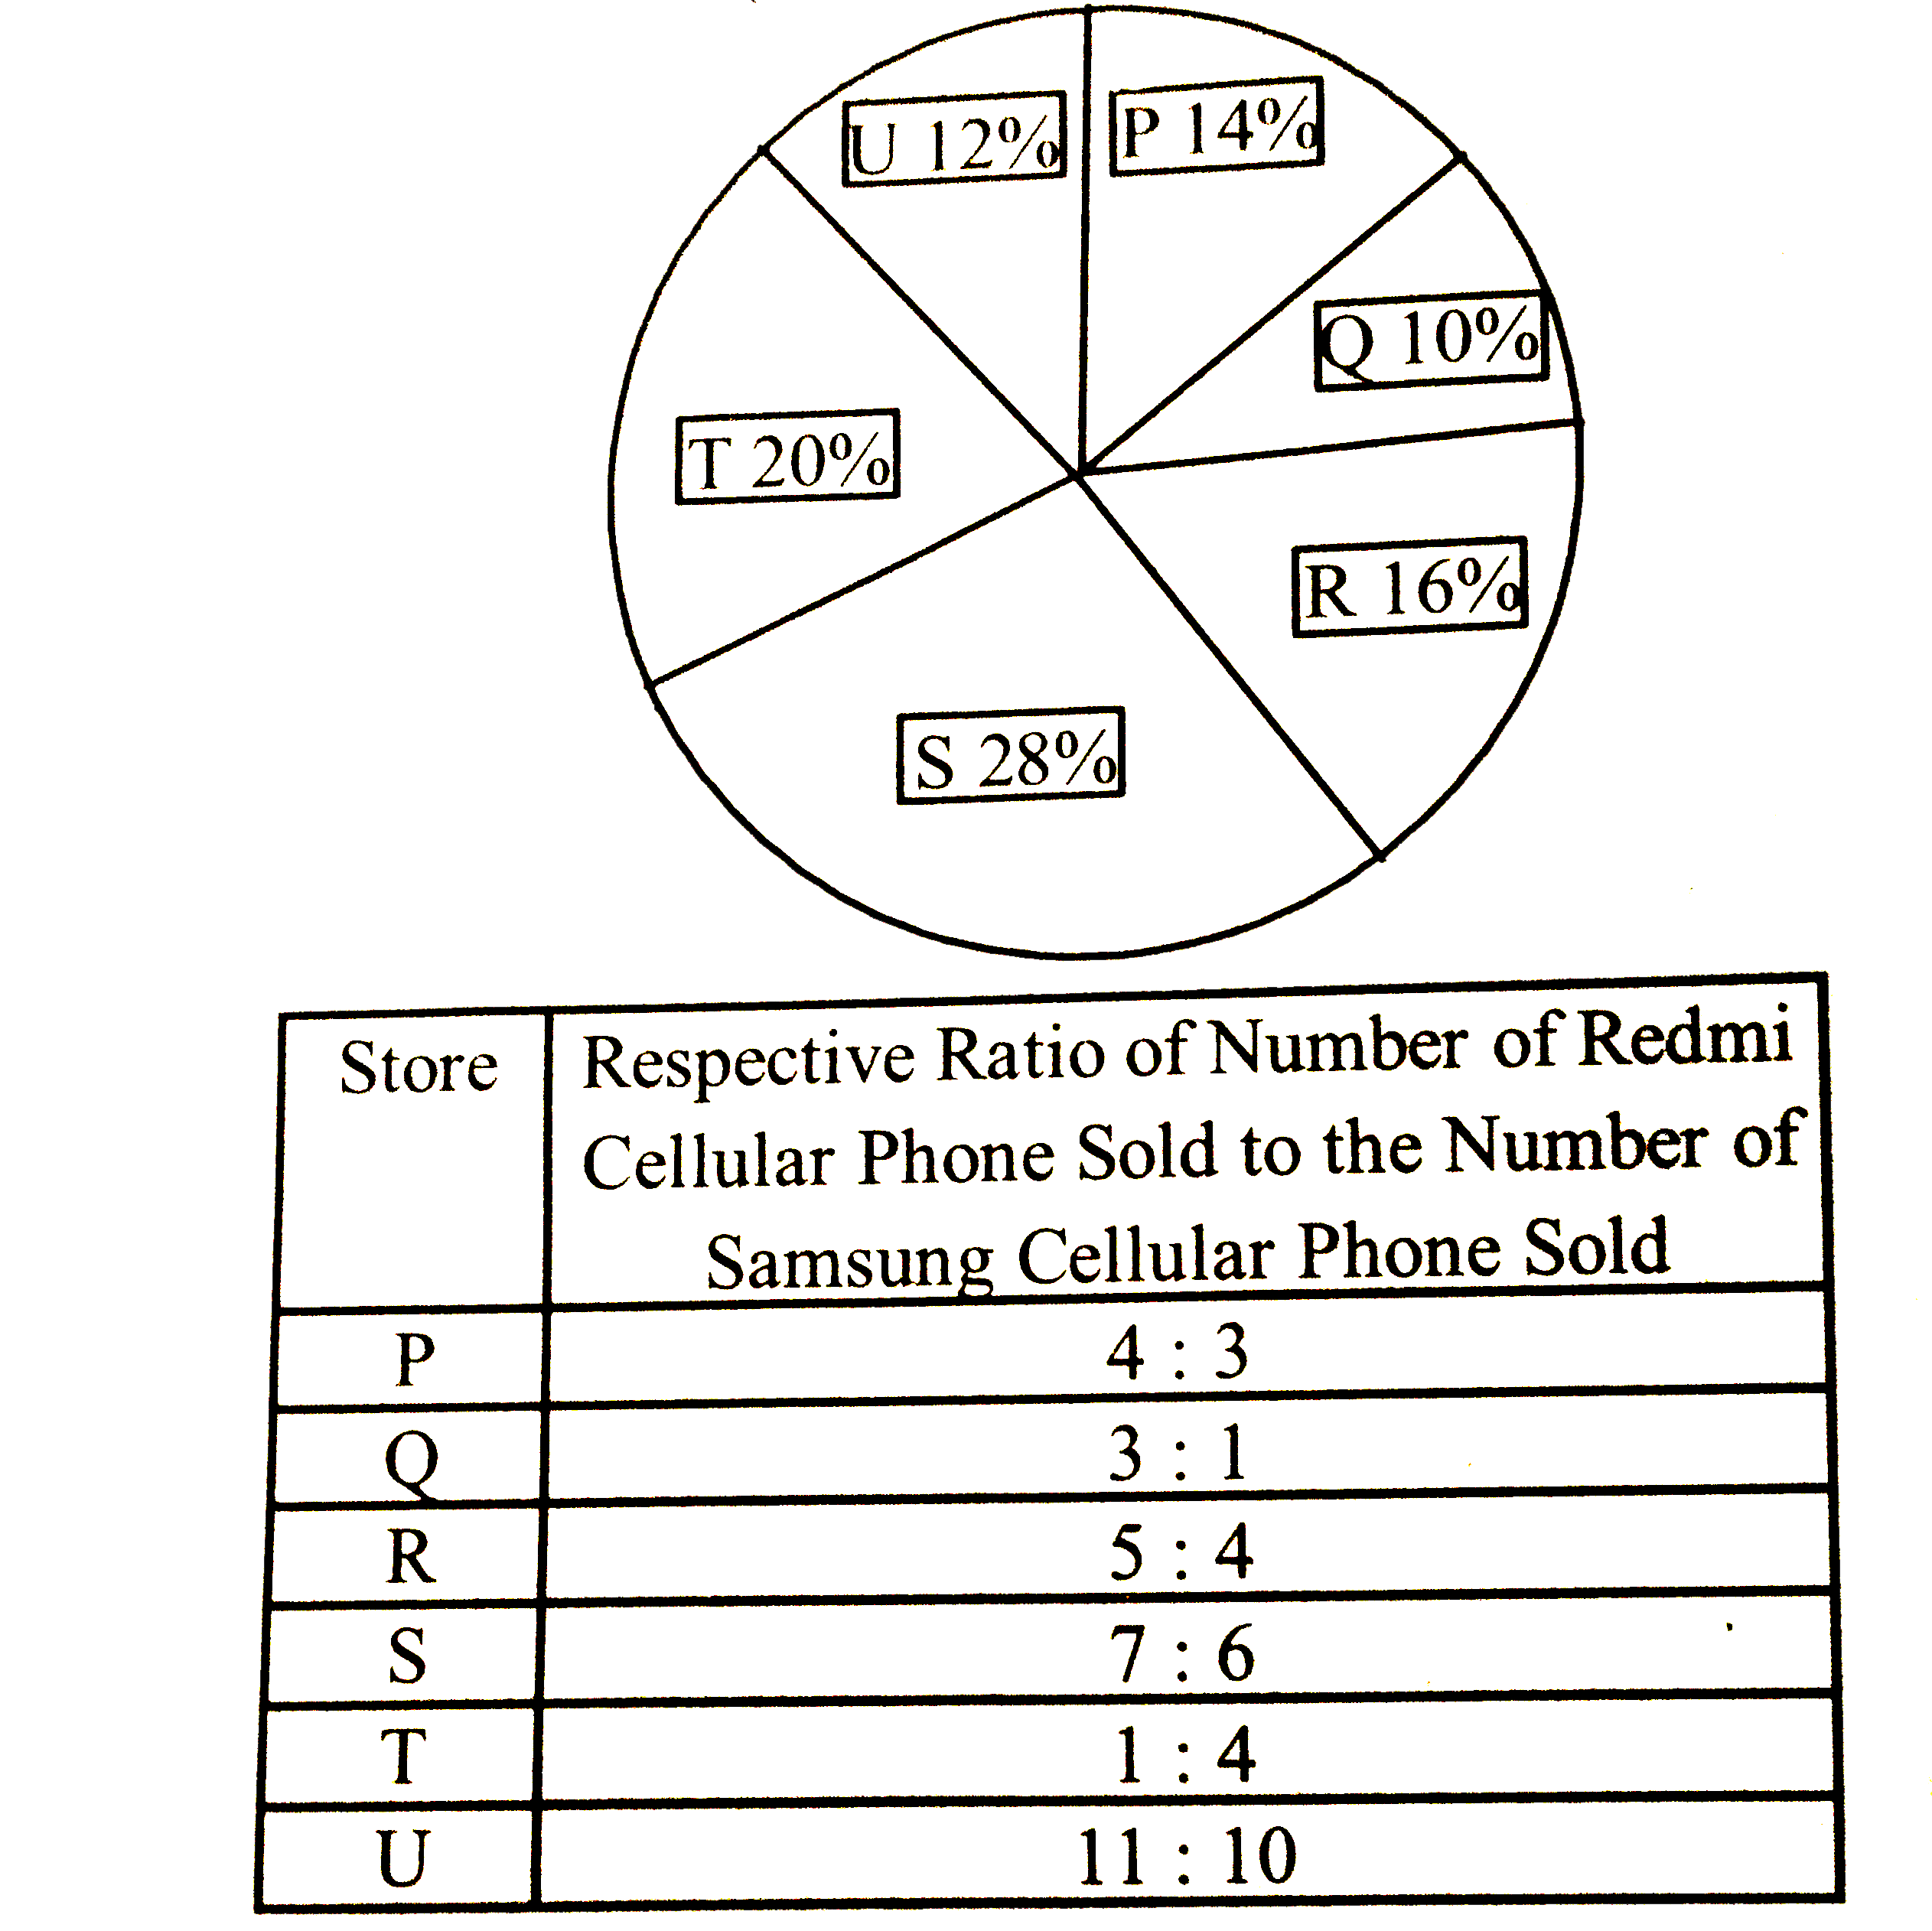
Number of Redmi cellular sold by store R is what percent more than the total number of Samsung cellular phones sold by stores P and Q together ?
View SolutionDirection: Study the following information carefully and answer the given questions: The following pie chart shows the percentage distribution of total number of Apples (Dry +dry)
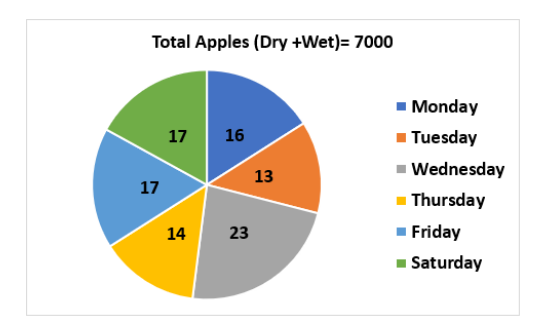
The pie chart2 shows the percentage distribution of total number of Apples (Wet) sold in different days of a week.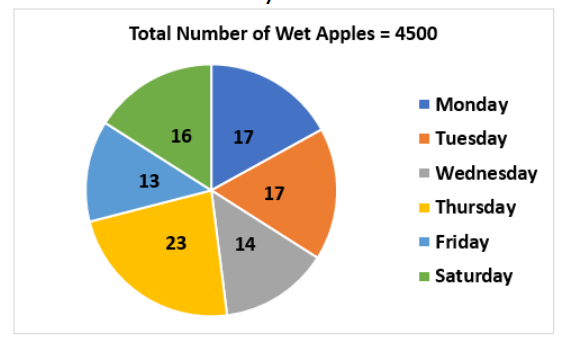
What is the ratio of dry apples sold on Monday to that sold on Saturday?
View SolutionThe given pie chart shows the quantity wise sales distribution of five products (A B C D E) of a company in 2016
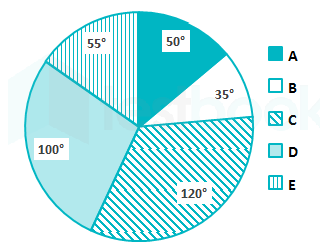
If 1500 units of products D were sold in 2016 and the total number of units sold by the company in 2017 was 18% more than that sold in 2016, then the total units sold by the company in 2017 is:
View SolutionDirections: Refer to the following graph and answer the given questions. Data related to the number of shoes sold by two stores (A and B )during five years:
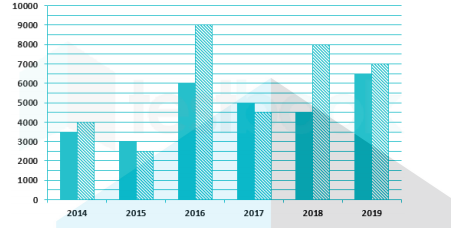
If the respective ratio between the total number of shoes sold by stores A and B together in 2014 and that in 2020 is 5 : 7.What is the total number of shoes sold by stores A and B together in 2020?
View SolutionThe data given below shows the number motorcycles of the same brand sold by two dealers in the first six months of a year
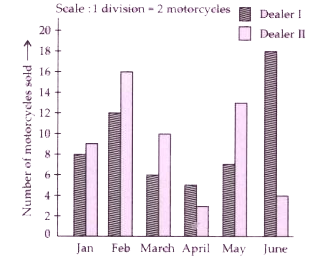
Find the total number of motorcycles sold by dealer II
View Solution
