Draw a pictograph for representing the number of students in each class based on the given data.

Step by step video & image solution for Draw a pictograph for representing the number of students in each class based on the given data. by Maths experts to help you in doubts & scoring excellent marks in Class 6 exams.
Updated on:21/07/2023Topper's Solved these Questions
- DATA HANDLING BOOK - MTG IIT JEE FOUNDATIONCHAPTER - DATA HANDLING EXERCISE - Exercise (Subjective Problems (Long Answer Type)
10 Videos
- DATA HANDLING BOOK - MTG IIT JEE FOUNDATIONCHAPTER - DATA HANDLING EXERCISE - Exercise (Subjective Problems (Integer/Numerical Value Type )
10 Videos
- DATA HANDLING BOOK - MTG IIT JEE FOUNDATIONCHAPTER - DATA HANDLING EXERCISE - Exercise (Subjective Problems (Very Short Answer Type))
9 Videos
- BASIC GEOMETRICAL IDEASBOOK - MTG IIT JEE FOUNDATIONCHAPTER - BASIC GEOMETRICAL IDEASEXERCISE - OLYMPIAD/HOTS CORNER
10 Videos
- DECIMALSBOOK - MTG IIT JEE FOUNDATIONCHAPTER - DECIMALSEXERCISE - OLYMPIAD/HOTS CORNER
20 Videos
Similar Questions
Draw a pictograph to represent the data given below :

View SolutionThe given pictograph represents the number of students in 5 sections of class VI.
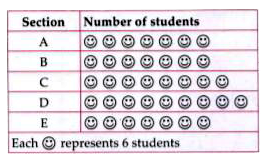
Study the given pictograph and answer the following questions.
Which section has 48 students ?
View SolutionThe given pictograph represents the number of students in 5 sections of class VI.
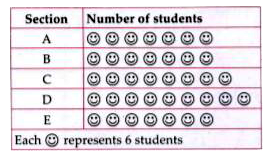
Study the given pictograph and answer the following questions.
How may students are there in section E ?
View SolutionThe given pictograph represents the number of students in 5 sections of class VI.
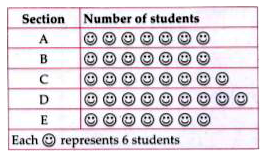
Study the given pictograph and answer the following questions.
Find the total number of students in 5 sections of Class VI.
View SolutionThe given pictograph represents the number of students in 5 sections of class VI.
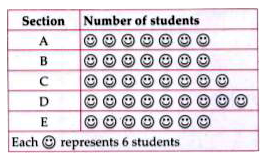
Study the given pictograph and answer the following questions.
How many less students are there in section E than section D ?
View SolutionThe given pictograph represents the number of students in 5 sections of class VI.
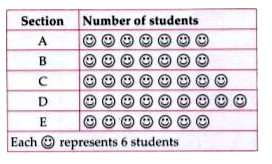
Study the given pictograph and answer the following questions.
Find the difference between the number of students in section E and the total number of students in section C and D together.
View SolutionDraw a histogram to represent the following data.

View SolutionThe given Venn diagram represent the number of students in a class who study three languages, French Spanish and Japanese.
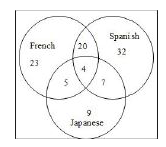
The number of students studying French, Spanish and Japanese is:
View SolutionThe ratio of the number of students of three class is 2:3:5 .If 20 students are added in each class then the ratio becomes 4:5:7.Find the number of student in each class before adding .
View SolutionDraw the histogram to represent the following data.

View Solution
