The following graph shows the temperature forecast and the actual temperature for each day of a week.
(a) On which days was the forecast temperature the same as the actual temperature?
(b) What was the maximum forecast temperature during the week?
(c) What was the minimum actual temperature during the week?
(d) On which day did the actual temperature differ the most from the forecast temperature?
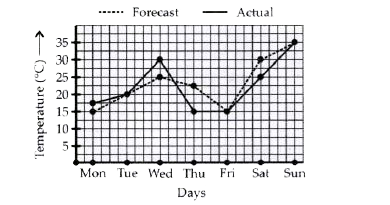
Step by step video & image solution for The following graph shows the temperature forecast and the actual temperature for each day of a week. (a) On which days was the forecast temperature the same as the actual temperature? (b) What was the maximum forecast temperature during the week? (c) What was the minimum actual temperature during the week? (d) On which day did the actual temperature differ the most from the forecast temperature? by Maths experts to help you in doubts & scoring excellent marks in Class 8 exams.
Updated on:21/07/2023Topper's Solved these Questions
- INTRODUCTION TO GRAPHS BOOK - MTG IIT JEE FOUNDATIONCHAPTER - INTRODUCTION TO GRAPHS EXERCISE - NCERT SECTIONS (15.2)
6 Videos
- INTRODUCTION TO GRAPHS BOOK - MTG IIT JEE FOUNDATIONCHAPTER - INTRODUCTION TO GRAPHS EXERCISE - NCERT SECTIONS (15.3)
4 Videos
- INTRODUCTION TO GRAPHS BOOK - MTG IIT JEE FOUNDATIONCHAPTER - INTRODUCTION TO GRAPHS EXERCISE - SOLVED EXAMPLES
25 Videos
- FOOTSTEPS TOWARDS JEE MAINBOOK - MTG IIT JEE FOUNDATIONCHAPTER - FOOTSTEPS TOWARDS JEE MAINEXERCISE - Section B (Numerical Value Type Questions)
9 Videos
- LINEAR EQUATIONS IN ONE VARIABLEBOOK - MTG IIT JEE FOUNDATIONCHAPTER - LINEAR EQUATIONS IN ONE VARIABLEEXERCISE - Olympiad/HOTS Corner
15 Videos
Similar Questions
The following line graph shows the temperature forecast and the actual temperature for each day of a week.
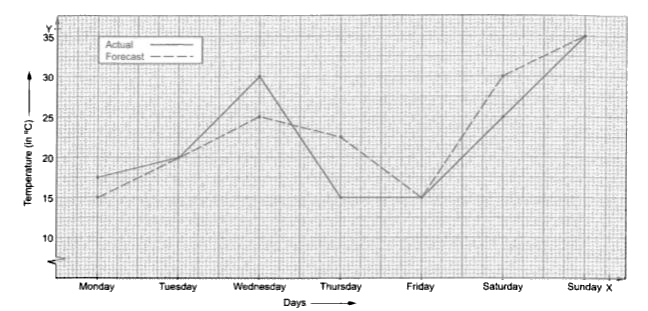
Study the above double line graph carefully and answer the questions given below:
(i) On which days was the forecast temperature the same as the actual temperature?
(ii) What was the maximum forecast temperature during the week ?
(iv) On which day did the actual temperature differ the most from the forecast temperature?
View SolutionThe graph shows the maximum temperatures recorded for two consecutive weeks of a town. Study the graph and answer the questions that follow.
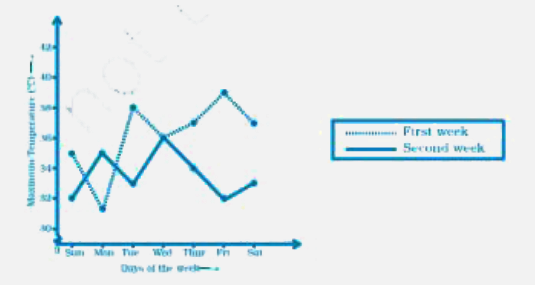
(a) What information is given by the two axes?
(b) In which week was the temperature higher on most of the days?
(c) On which day was the temperature same in both the weeks?
(d) On which day was the difference in temperatures the maximum for both the weeks?
(e) What were the temperatures for both the weeks on Thursday?
(f) On which day was the temperature 35°C for the first week?
(g) On which day was the temperature highest for the second week?
View Solution
Knowledge Check
Maximum temperature of the day occurs generally
AIn the afternoonBWhen the sun risesCWhen the sun setsDIn the eveningThe following graph represents the maximum and minimum temperature recorded every day in a certain week. The day on which the difference between the maximum and minimum temperature was maximum is
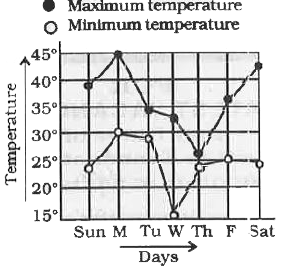 AWednesdayBSaturdayCSundayDMonday
The following graph shows the temperature of a patient observed in a hospital at a certain interval of time on a certain day. Starting at 5 A.M.
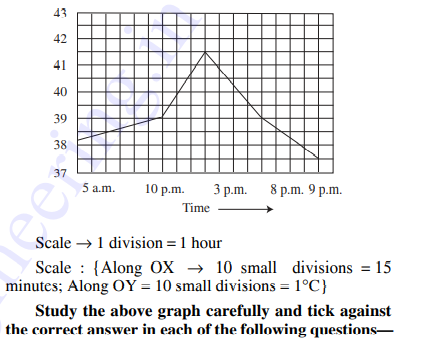
What was the maximum temperature during the day ?A40.7∘CB41.5∘CC40.8∘CD41∘C
The graph given below shows the maximum temperature during the last week of April. The maximum temperature 35∘ C was on ___
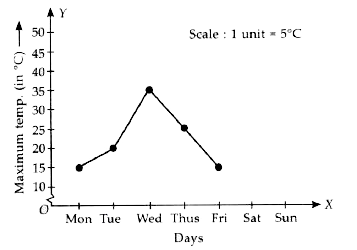
View SolutionThe graph below shows the outside temperature at various times of day.
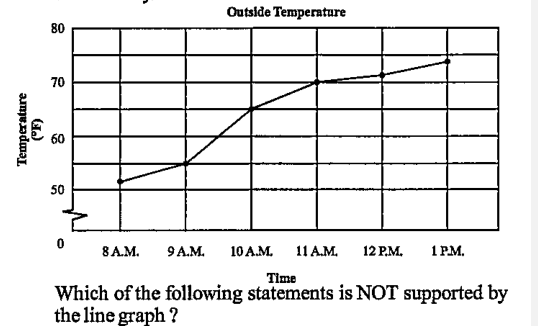
View SolutionWhen are the maximum and minimum temperatures likely to occur during the day?
View SolutionThe following graph shows the temperature of a patient observed in a hospital at a certain interval of time on a certain day. Starting at 5 A.M.
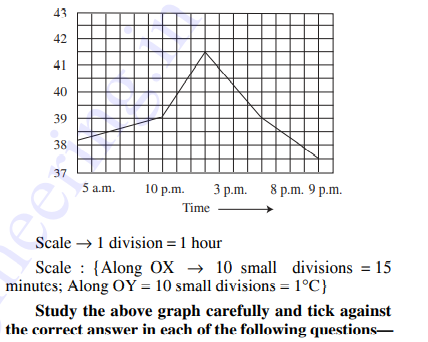
What was the temperature of the patient at 2 p.m.?
View SolutionThe following graph shows the temperature of a patient observed in a hospital at a certain interval of time on a certain day. Starting at 5 A.M.
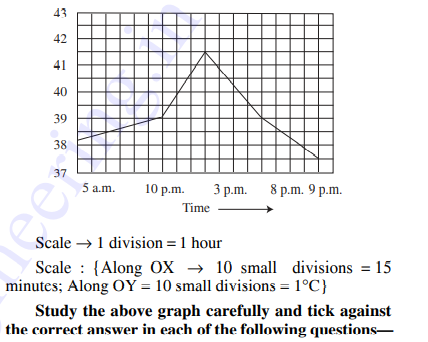
At what time during the day, the temperature was maximum ?
View Solution
