The graph shown in figure exhibits the production of rice for different years. Read the graph and find, in which period was the production remains constant?
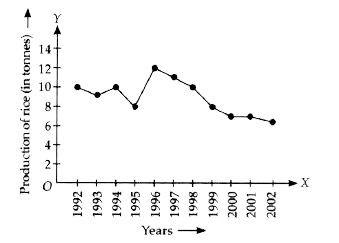
1997−1998
1994−1998
2000−2001
1996−1997
Step by step video & image solution for The graph shown in figure exhibits the production of rice for different years. Read the graph and find, in which period was the production remains constant? by Maths experts to help you in doubts & scoring excellent marks in Class 8 exams.
Updated on:21/07/2023Topper's Solved these Questions
- INTRODUCTION TO GRAPHS BOOK - MTG IIT JEE FOUNDATIONCHAPTER - INTRODUCTION TO GRAPHS EXERCISE - EXERCISE (INTEGER/NUMERICAL VALUE TYPE)
5 Videos
- FOOTSTEPS TOWARDS JEE MAINBOOK - MTG IIT JEE FOUNDATIONCHAPTER - FOOTSTEPS TOWARDS JEE MAINEXERCISE - Section B (Numerical Value Type Questions)
9 Videos
- LINEAR EQUATIONS IN ONE VARIABLEBOOK - MTG IIT JEE FOUNDATIONCHAPTER - LINEAR EQUATIONS IN ONE VARIABLEEXERCISE - Olympiad/HOTS Corner
15 Videos
Similar Questions
The graph shown in Figure exhibits the rate of interest on fixed deposits upto one year announced by the Reserve Bank of India in different years. Read the graph and find:
In which period was the rate of interest maximum?
In which period was the rate of interest minimum?
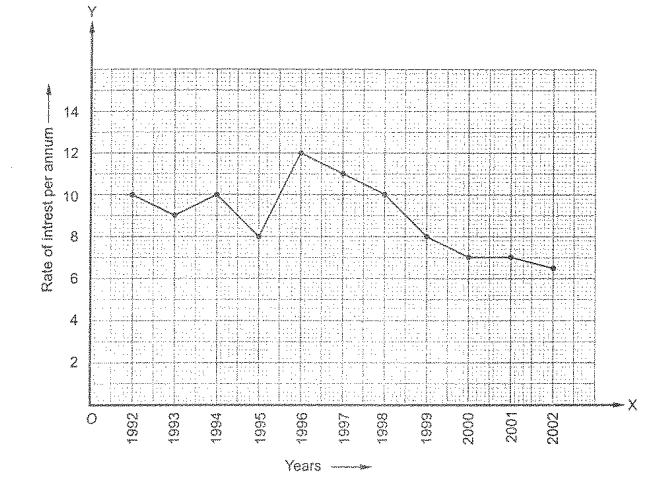
View SolutionThe graph exhibits the rate of interest on fixe deposits upto one year announced by the Reserve Bank of India in different years. Read the graph and find :
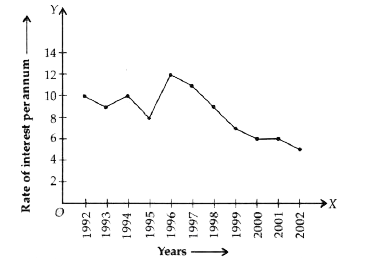
(i) In which period was the rate of interest maximum?
(ii) In which period was the rate of interest minimum?
View Solution
Knowledge Check
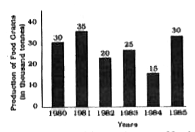
The graph shows the production of food grains of a country in different years. Study the graph and answer the questions.
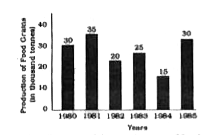
The difference between the production of food grains in the years 1981 and 1985 isA500 tonnesB100 tonnesC5000 tonnesD10000 tonnesThe graph shows the production of food grains of a country in different years. Study the graph and answer the questions.
The percentage increase in production from 1984 to 1985 wasA15B30C50D100The graph shows the production of food grains of a country in different years. Study the graph and answer the questions.
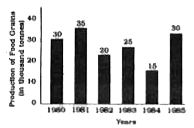
The sum of the production of food grains in the years 1982 and 1984 is equal to that in the year :A1980B1981C1983D1985
Reading the graph of production of paper by three company in different years
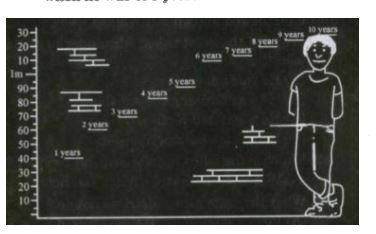
View SolutionRead the graph and find the height of Tarun when he was of 5 years?
View SolutionRead the graph and answer the following questions
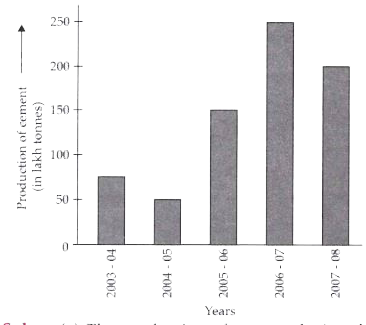
During which period, the production was minimum ?
View SolutionThe graph shows the production of food grains of a country in different years. Study the graph and answer the questions.
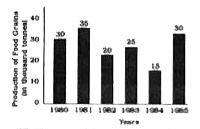
The two consecutive years in which rate of change of production of food grains is minimum are
View SolutionThe line graph shows the production of steel of a certain country. Study the diagram and answer the following questions.
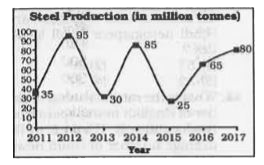
In which year was the steel production lesser than that of the previous year?
View Solution
