Which of the following represents distance(s)-time(t) graph for a retarded motion?


The correct Answer is:C
To determine which distance-time (s-t) graph represents retarded motion, we need to understand what retarded motion means. Retarded motion refers to the motion of an object that is slowing down or decelerating.
1. Understanding Distance-Time Graphs:
- A distance-time graph plots distance (s) on the y-axis and time (t) on the x-axis. The slope of the graph indicates the speed of the object.
2. Identifying Retarded Motion:
- In retarded motion, the object is moving but slowing down. This means that as time progresses, the distance covered in each subsequent time interval decreases.
3. Analyzing the Slope:
- For retarded motion, the slope of the distance-time graph should decrease over time. This indicates that the speed is decreasing.
4. Evaluating the Options:
- Look at each graph option provided. The correct graph will show a curve that starts steep (indicating higher speed) and becomes less steep (indicating lower speed) as time increases.
5. Selecting the Correct Graph:
- After analyzing the options, the graph that shows a decreasing slope over time represents retarded motion.
6. Conclusion:
- Based on the analysis, the correct answer is the graph that shows a decreasing slope, which corresponds to option C.
- A distance-time graph plots distance (s) on the y-axis and time (t) on the x-axis. The slope of the graph indicates the speed of the object.
- In retarded motion, the object is moving but slowing down. This means that as time progresses, the distance covered in each subsequent time interval decreases.
- For retarded motion, the slope of the distance-time graph should decrease over time. This indicates that the speed is decreasing.
- Look at each graph option provided. The correct graph will show a curve that starts steep (indicating higher speed) and becomes less steep (indicating lower speed) as time increases.
- After analyzing the options, the graph that shows a decreasing slope over time represents retarded motion.
- Based on the analysis, the correct answer is the graph that shows a decreasing slope, which corresponds to option C.
Topper's Solved these Questions
- MEASUREMENTS AND MOTIONBOOK - MTG IIT JEE FOUNDATIONCHAPTER - MEASUREMENTS AND MOTIONEXERCISE - EXERCISE (MATCH THE FOLLOWING)
3 Videos
- MEASUREMENTS AND MOTIONBOOK - MTG IIT JEE FOUNDATIONCHAPTER - MEASUREMENTS AND MOTIONEXERCISE - EXERCISE(ASSERTION & REASON TYPE)
8 Videos
- MEASUREMENTS AND MOTIONBOOK - MTG IIT JEE FOUNDATIONCHAPTER - MEASUREMENTS AND MOTIONEXERCISE - SOLVED EXAMPLES
13 Videos
- MAGNETIC EFFECTS OF ELECTRIC CURRENTBOOK - MTG IIT JEE FOUNDATIONCHAPTER - MAGNETIC EFFECTS OF ELECTRIC CURRENTEXERCISE - EXERCISE (INTEGER / NUMERICAL VALUE TYPE)
3 Videos
- SOME NATURAL PHENOMENABOOK - MTG IIT JEE FOUNDATIONCHAPTER - SOME NATURAL PHENOMENAEXERCISE - Olympaid/HOTS Corner
10 Videos
Similar Questions
The displacement-time graph of a particle executing simple harmonic motion is shown in the figure
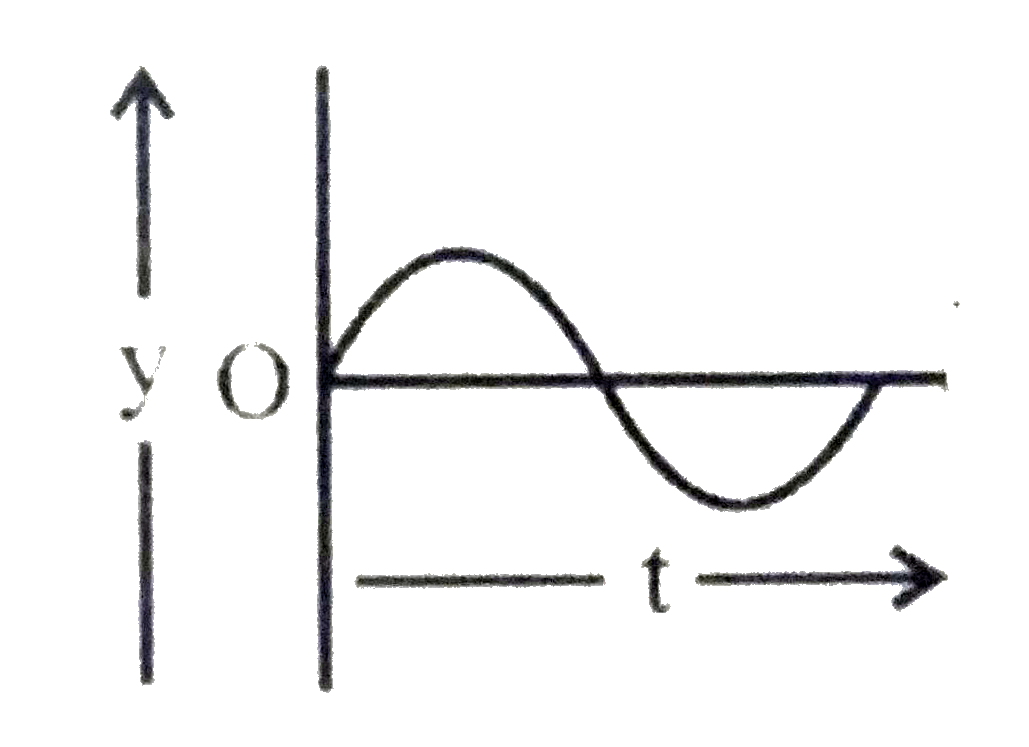
Which one of the following graphs is the correct forcetime graph for the motion of the particle ?
View SolutionConsider the following statements: Car I is parked near a post office II. Car II is moving along a straight road with uniform speed Which of the following distance?time graphs represents the motion of the respective cars?
View Solution
Knowledge Check
Which of the following graphs represents the displacement (s) -time (t) graph for uniform motion ?
A B
B C
C D
D
Which of the following distance-time graphs is not possible?
A B
B C
C D
D
Which of the following graph represents 3s orbital
A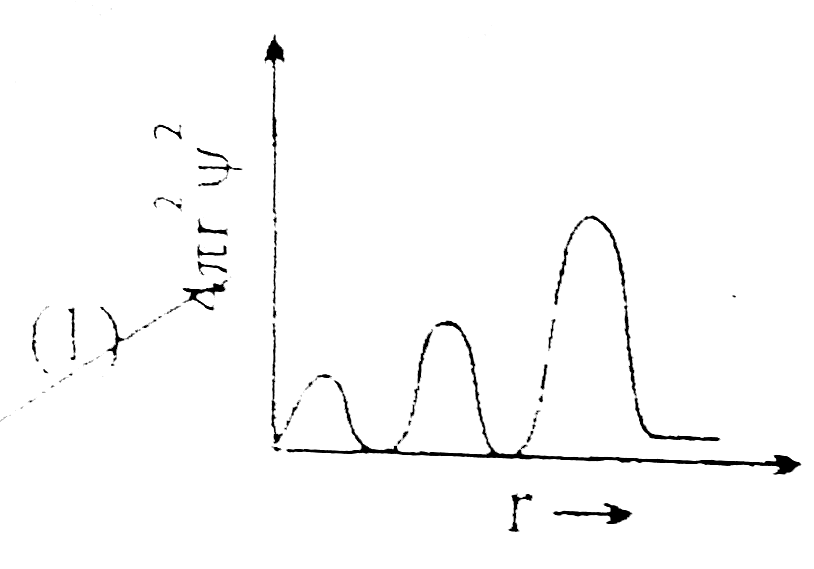 B
B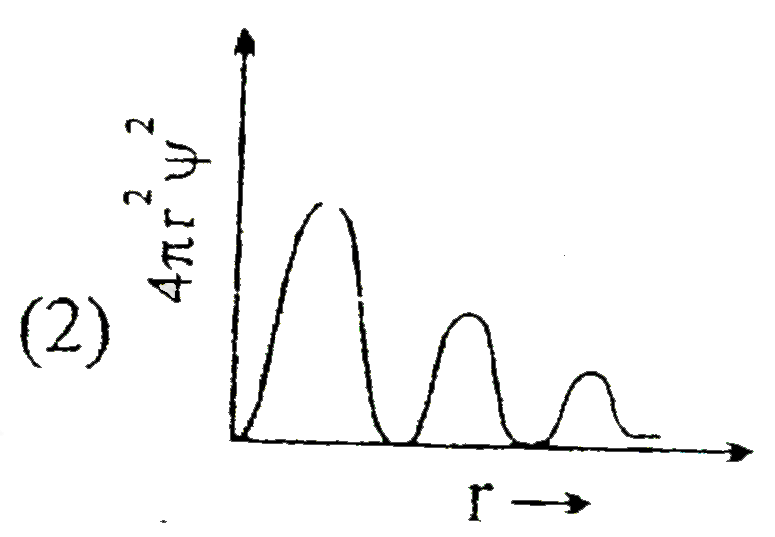 C
C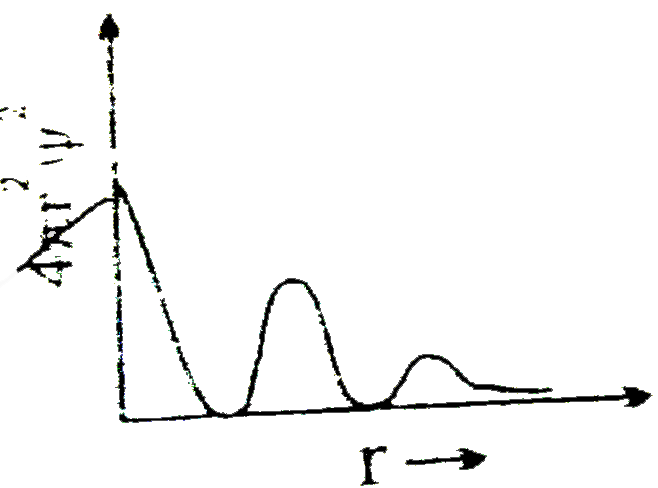 D
D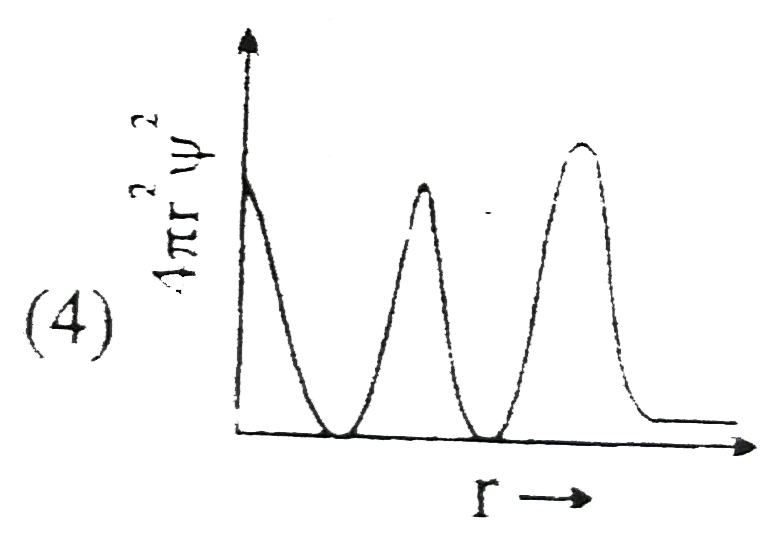
Which of the following distance-time graphs is not possible?
View SolutionWhich of the following graph represents uniform motion
View SolutionWhich one of the following graphs represents motion?
View SolutionWhich of the following x-t graphs represents the distance-time variation of a body released from the top of a buiding?
View SolutionWhich of the following distance time graphs is possible ?
View Solution
