Which of the following x-t graphs represents the distance-time variation of a body released from the top of a buiding?
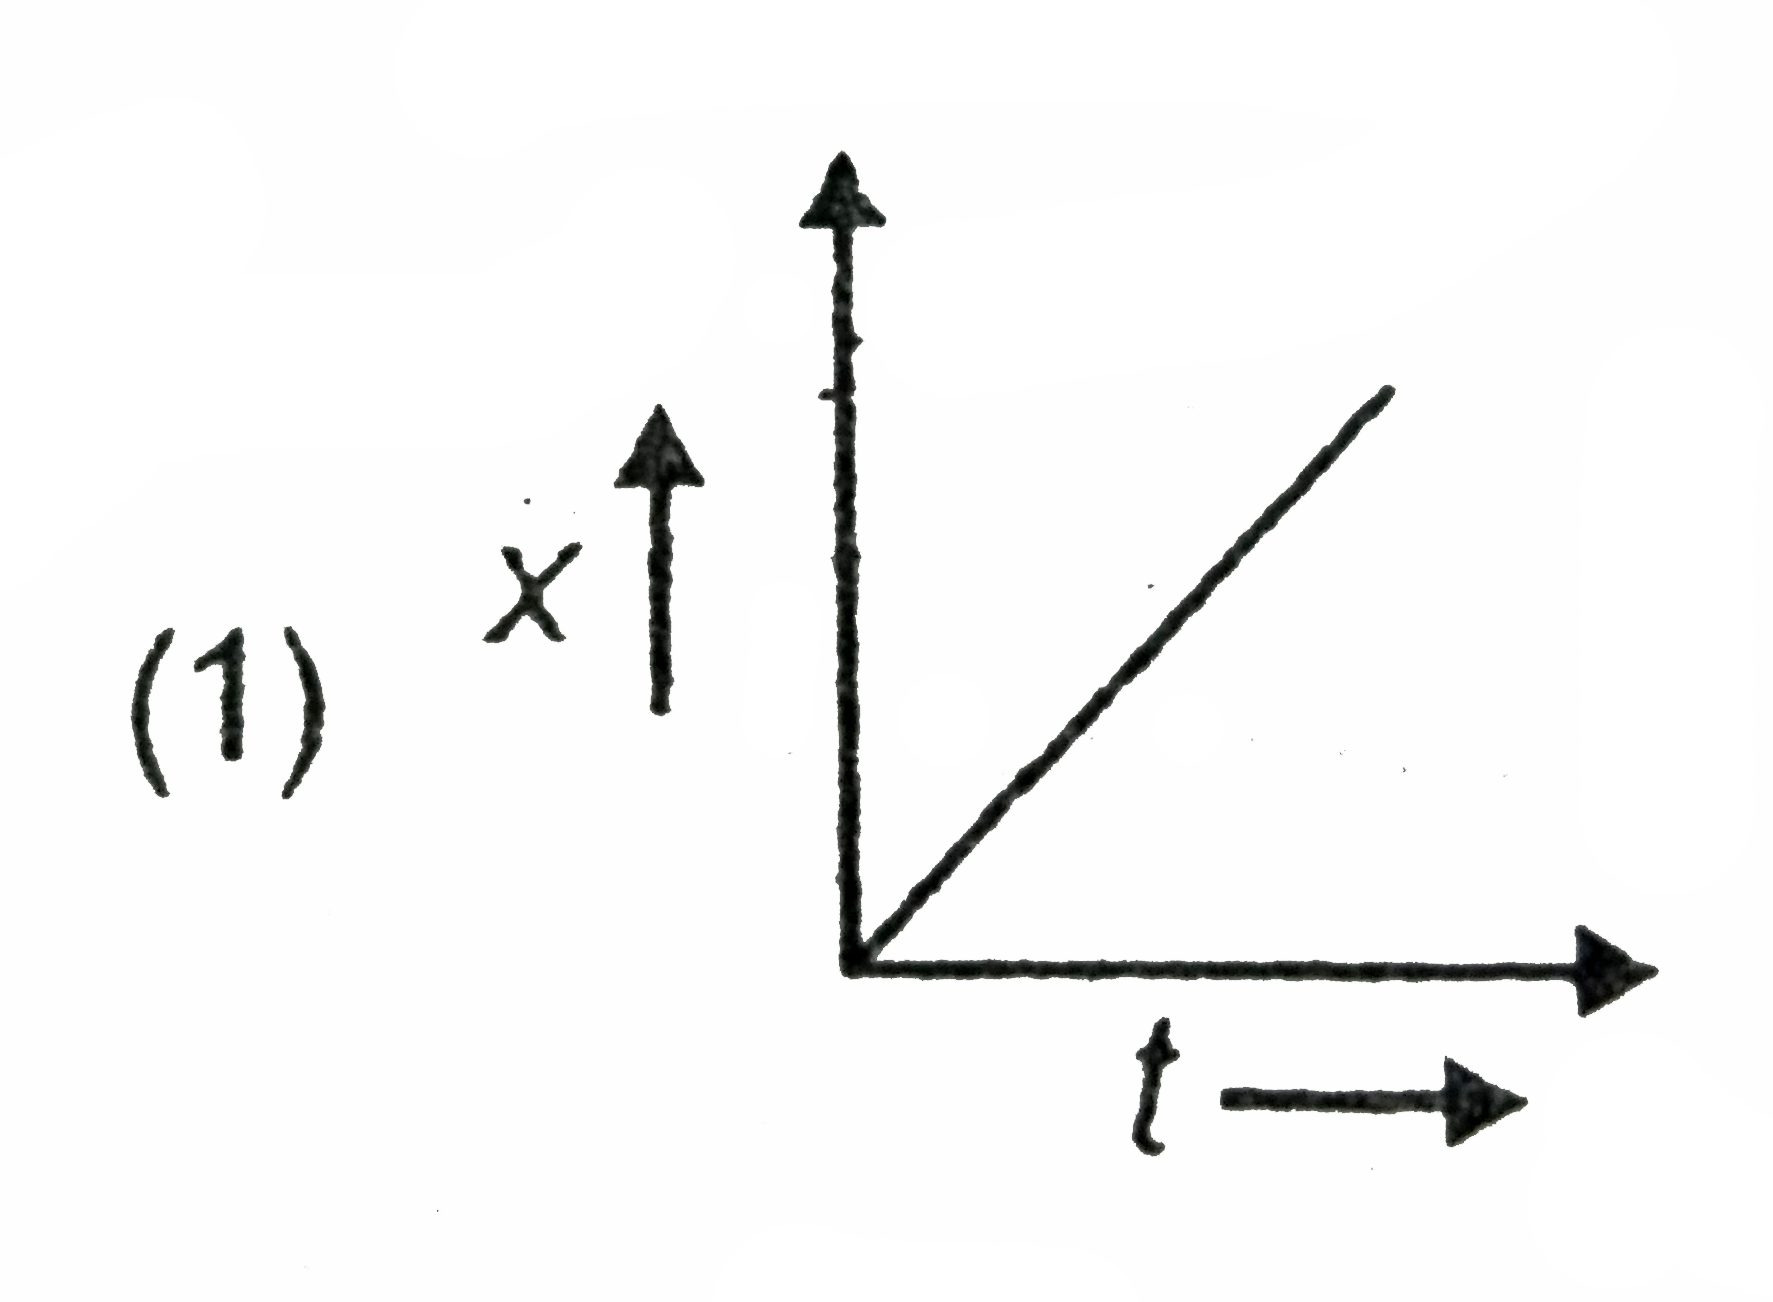
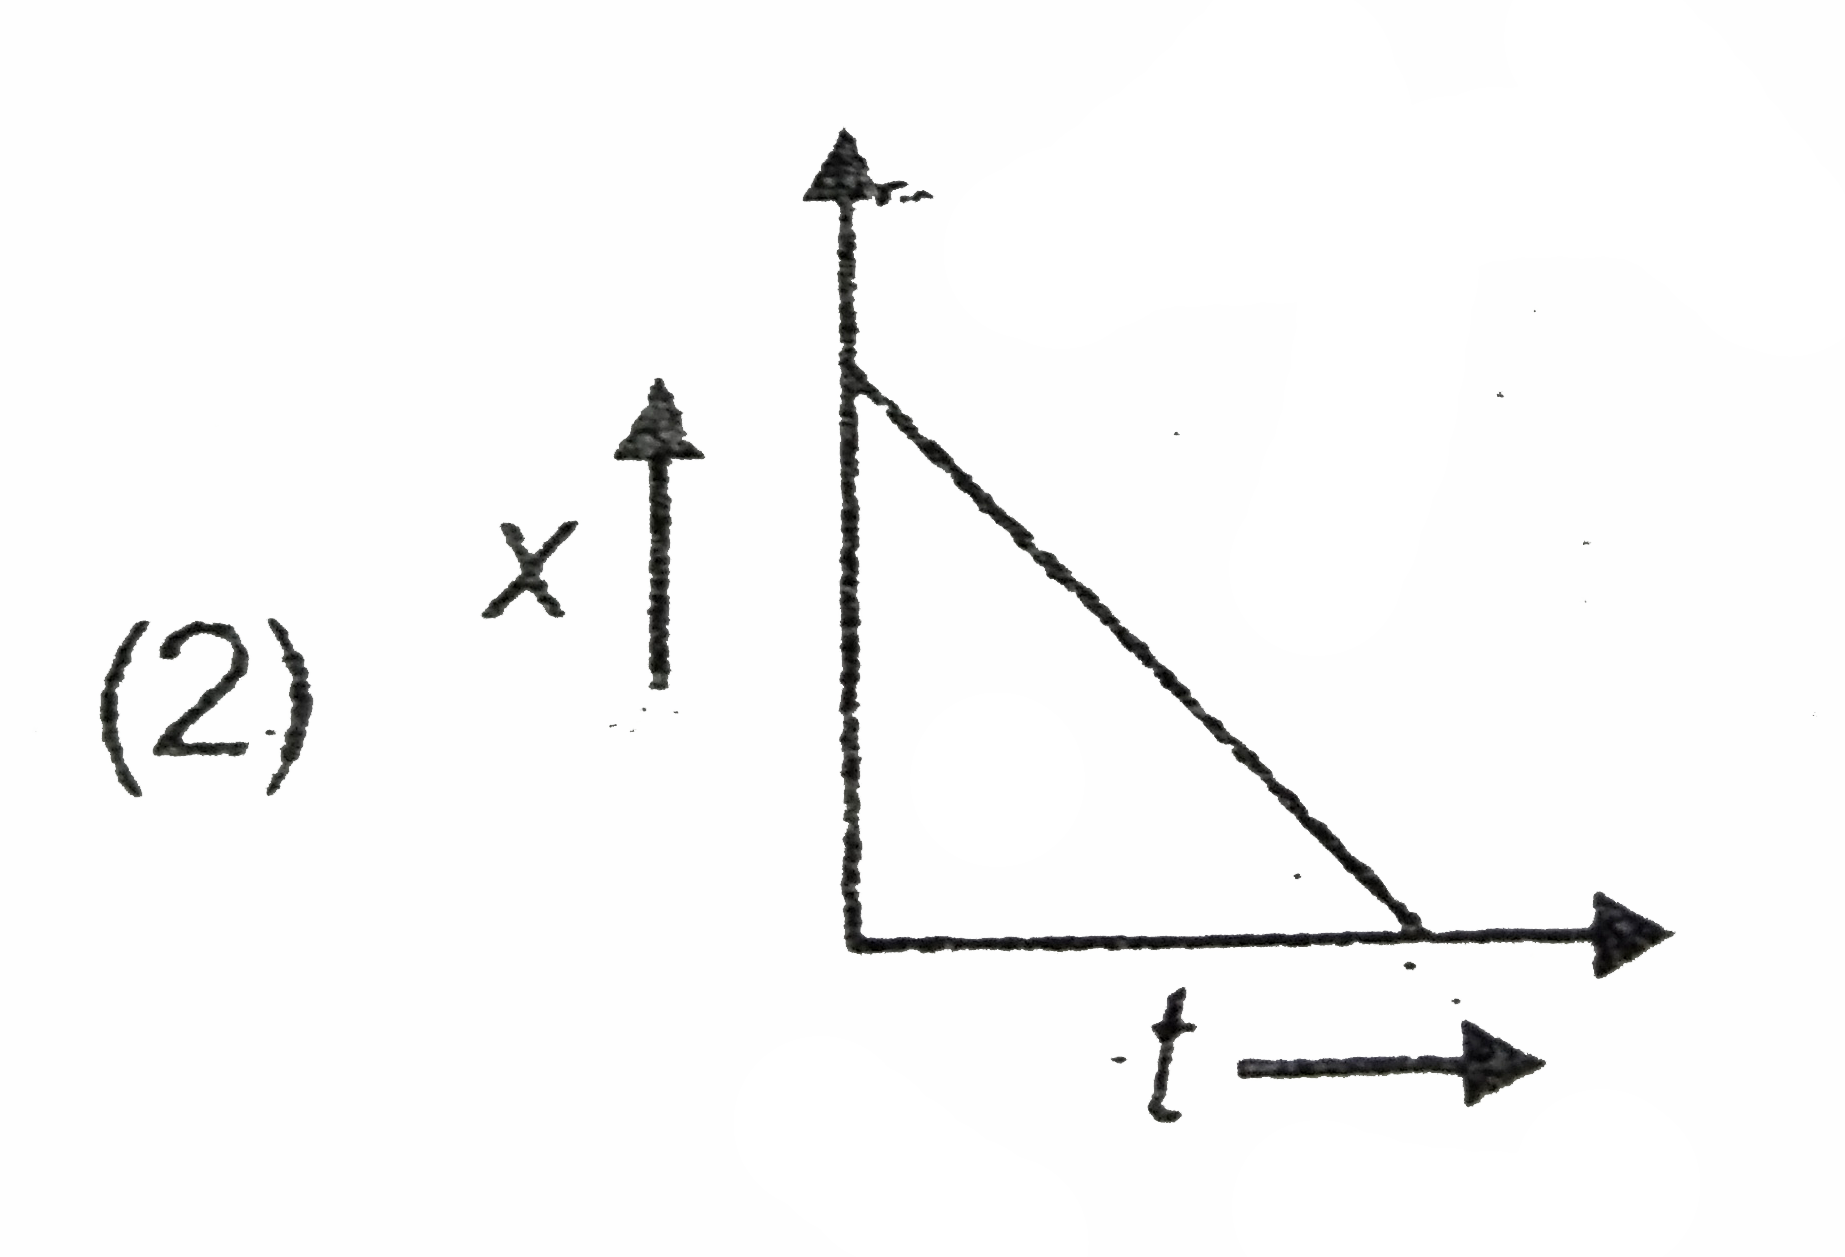
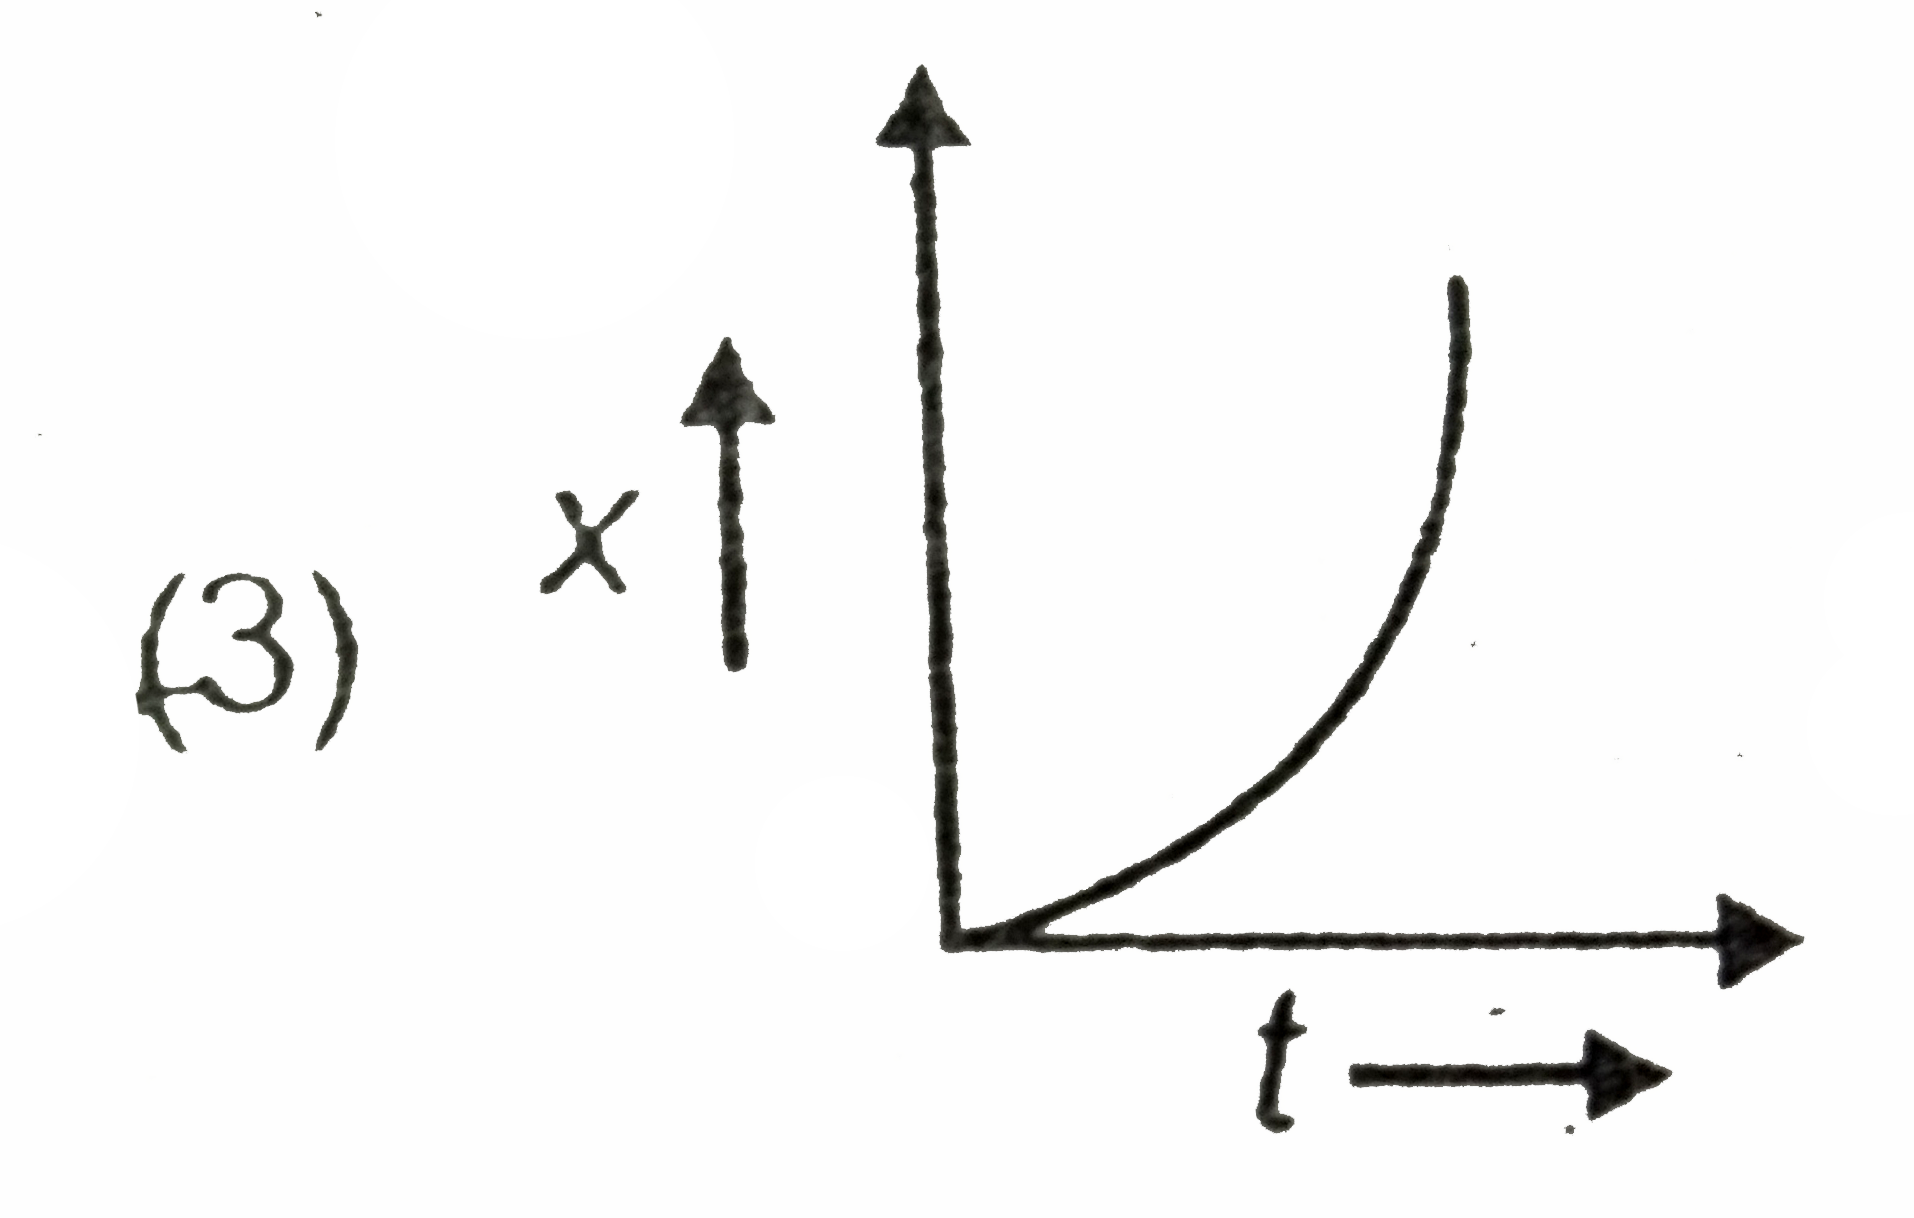
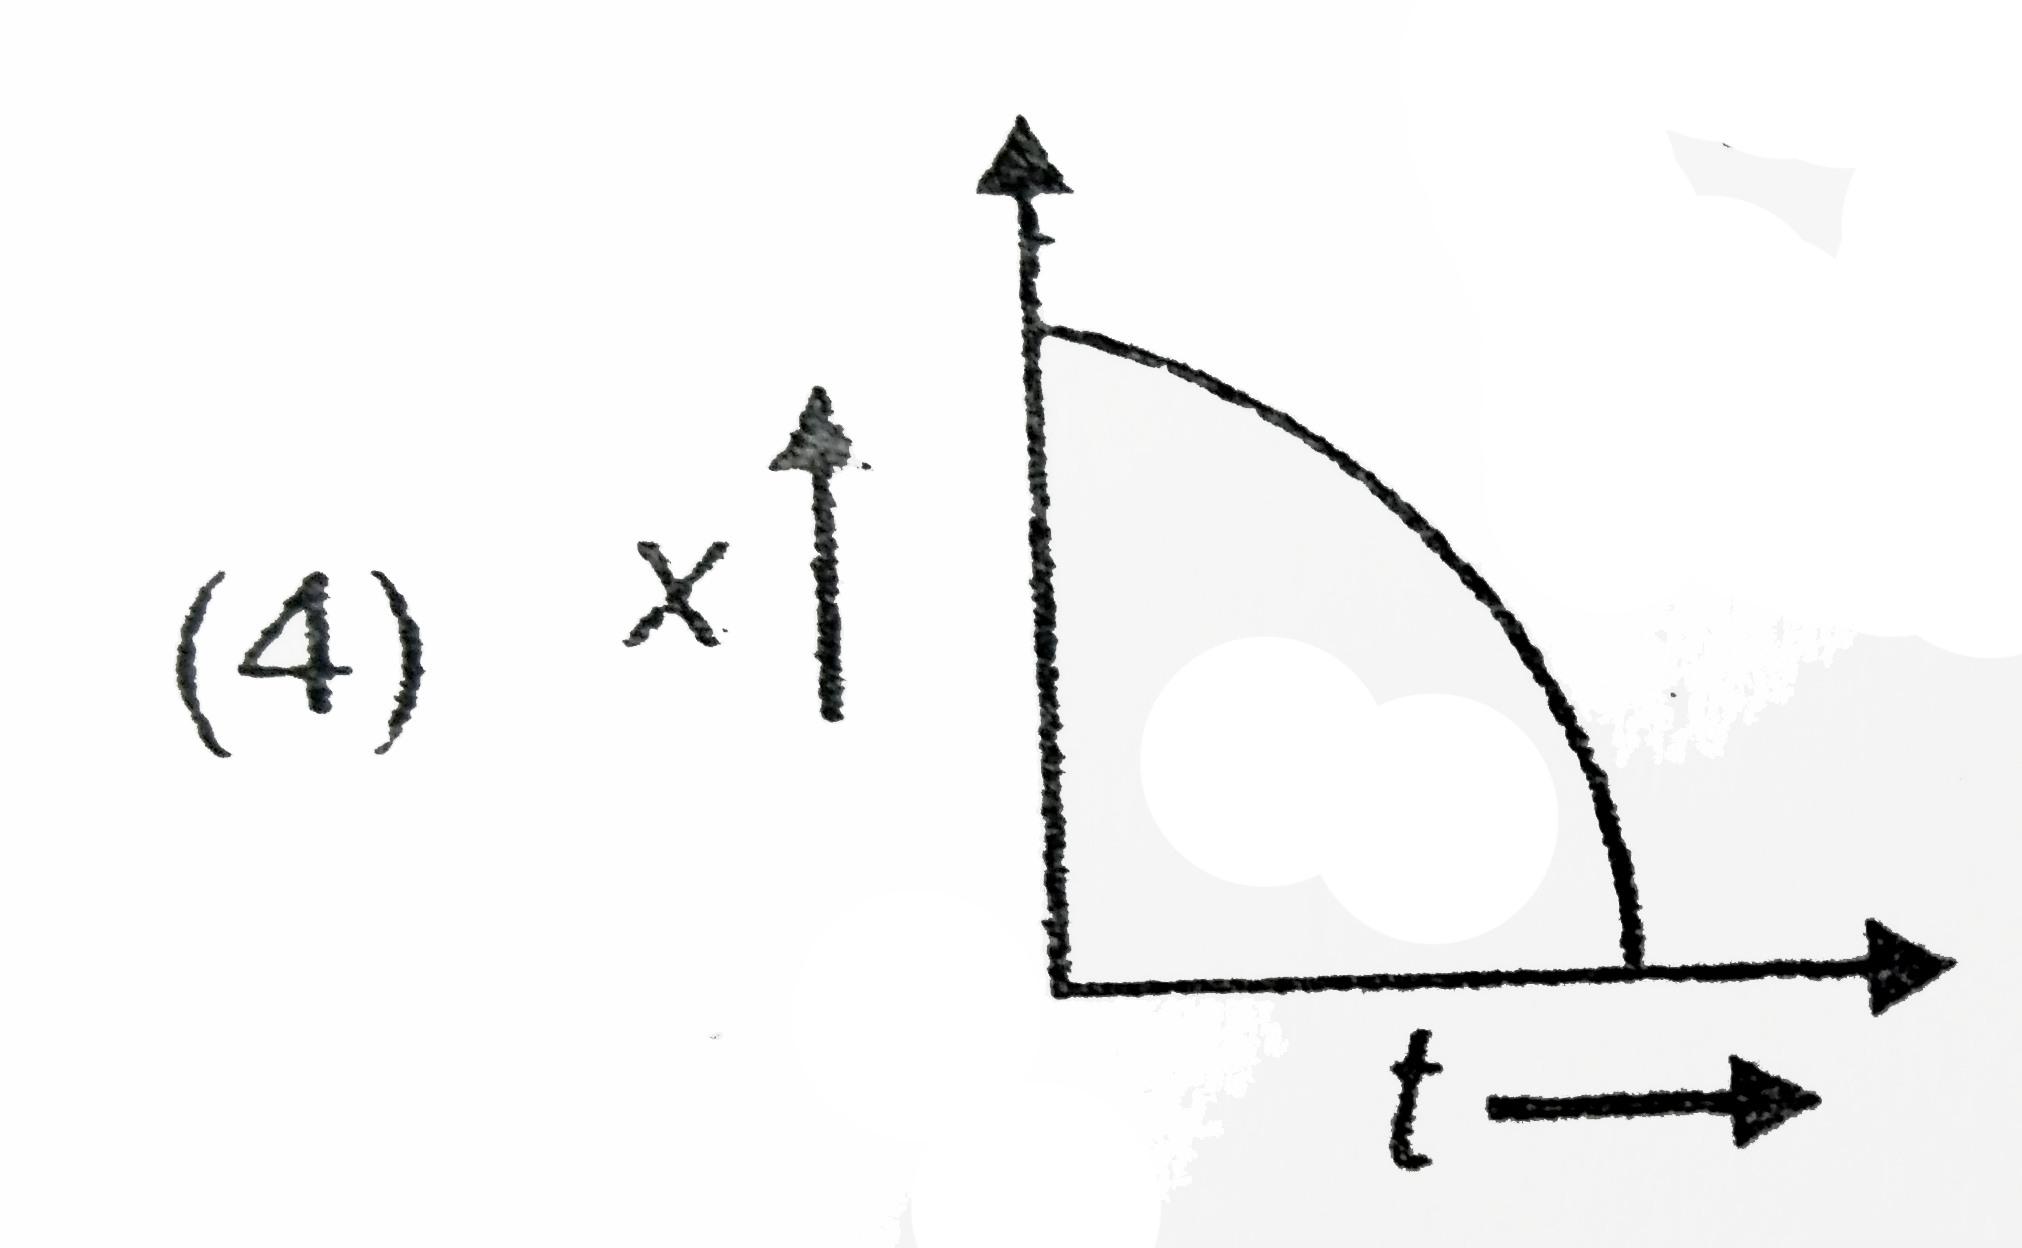
The correct Answer is:C
Step by step video, text & image solution for Which of the following x-t graphs represents the distance-time variation of a body released from the top of a buiding? by Physics experts to help you in doubts & scoring excellent marks in Class 12 exams.
Topper's Solved these Questions
- BOOK - AAKASH INSTITUTECHAPTER - MOTION IN STRAIGHT LINEEXERCISE - Assignment (SECTION - B)19videos
MOTION IN STRAIGHT LINE
- BOOK - AAKASH INSTITUTECHAPTER - MOTION IN STRAIGHT LINEEXERCISE - Assignment (SECTION - C)7videos
MOTION IN STRAIGHT LINE
- BOOK - AAKASH INSTITUTECHAPTER - MOTION IN STRAIGHT LINEEXERCISE - Try Yourself40videos
MOTION IN STRAIGHT LINE
- BOOK - AAKASH INSTITUTECHAPTER - MOTION IN A STRAIGHT LINEEXERCISE - ASSIGNMENT (SECTION - D)15videos
MOTION IN A STRAIGHT LINE
- BOOK - AAKASH INSTITUTECHAPTER - MOVING CHARGE AND MAGNESIUMEXERCISE - SECTION D16videos
MOVING CHARGE AND MAGNESIUM
Similar Questions
Which one of the following graphs represents the variation of electric field with distance r from the centre of a charged spherical conductor of radius R?
View SolutionGraph between velocity and displacement is shown in the following figure:
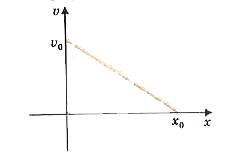
Which of the following graphes represents the correct variation of acceleration with displacementView Solution
Knowledge Check
- Question 1 - Select One
Which of the following x-t graphs does not represent periodic motion?
A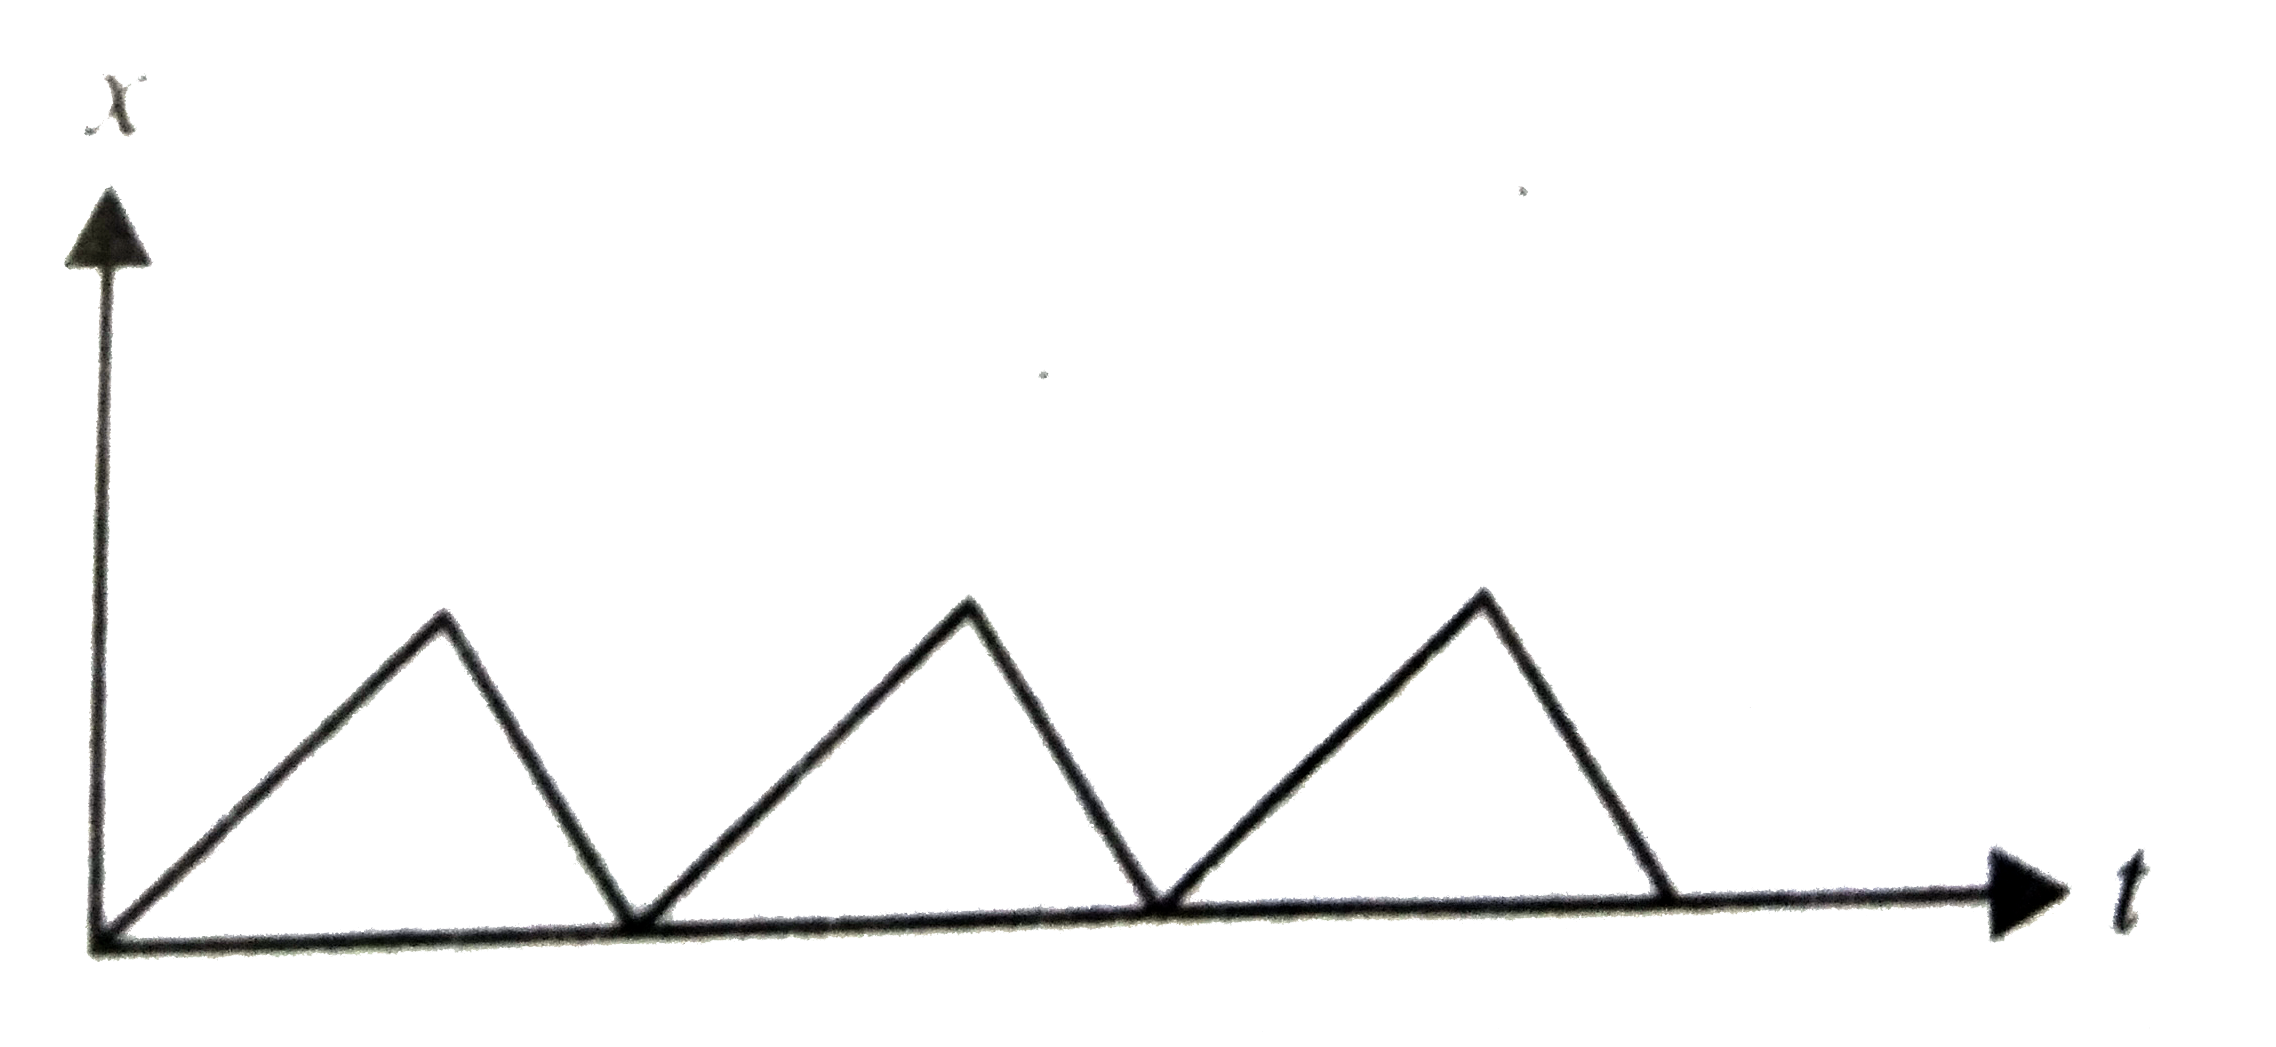 B
B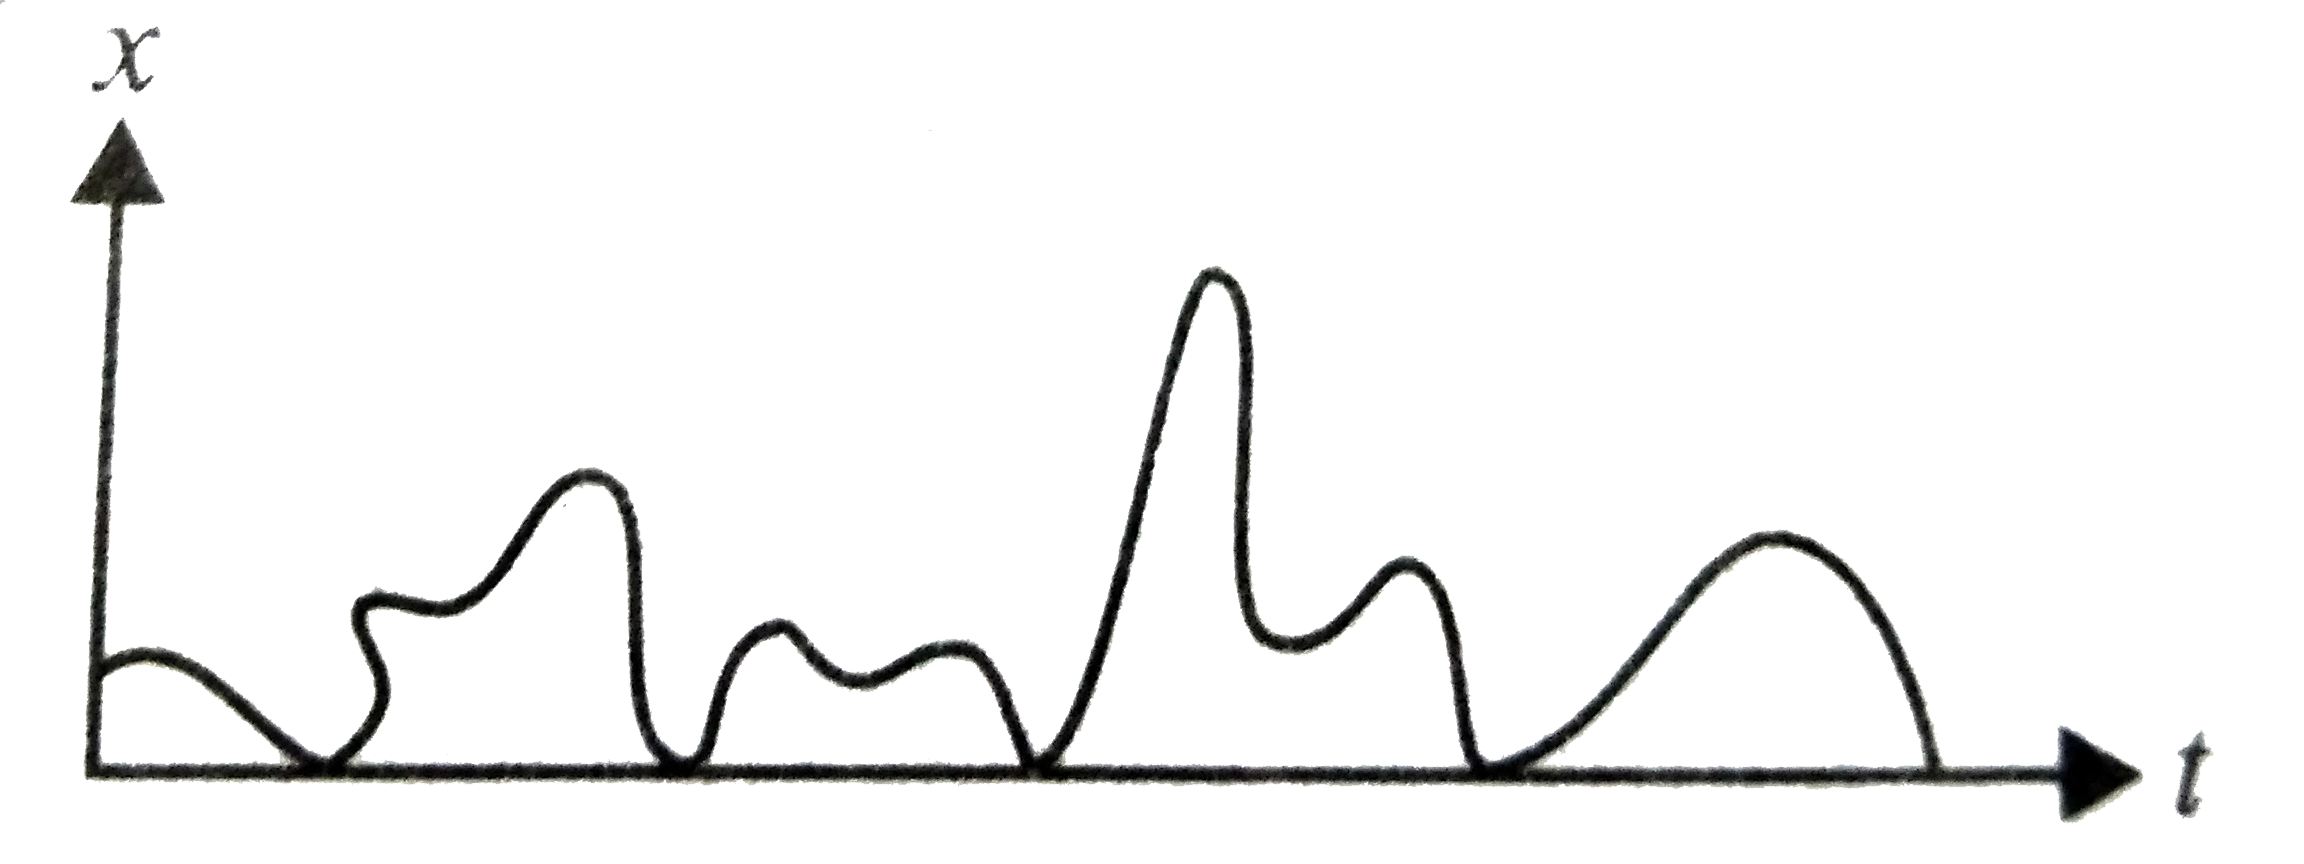 C
C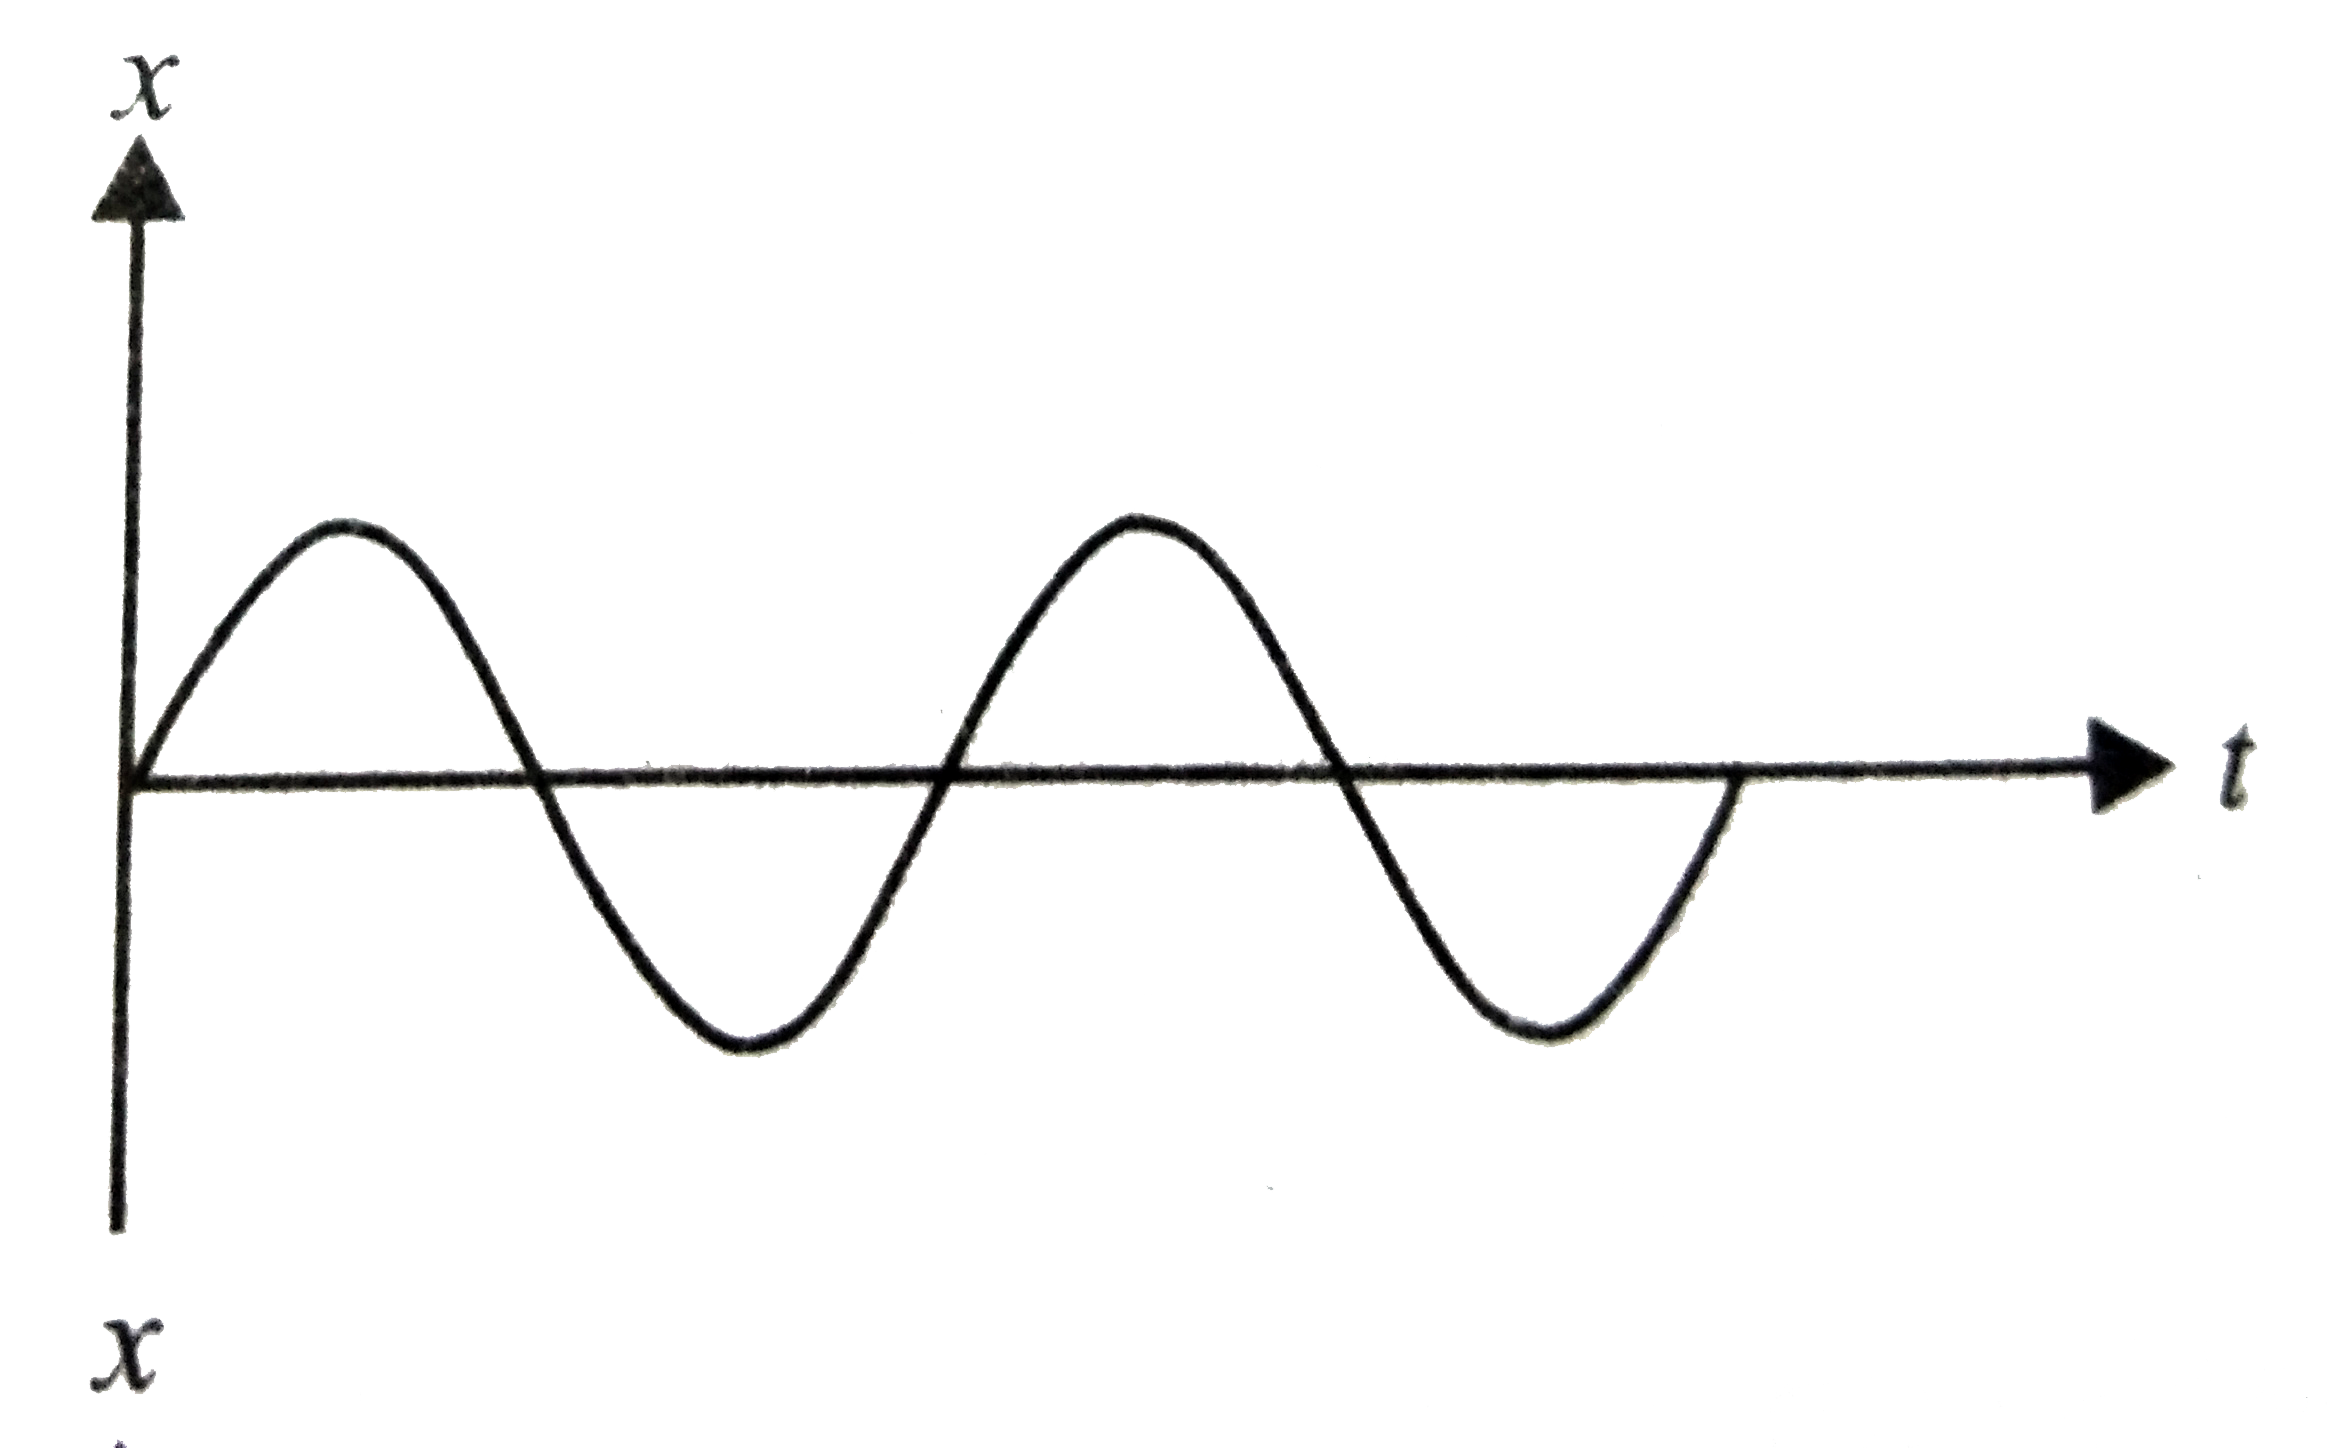 D
D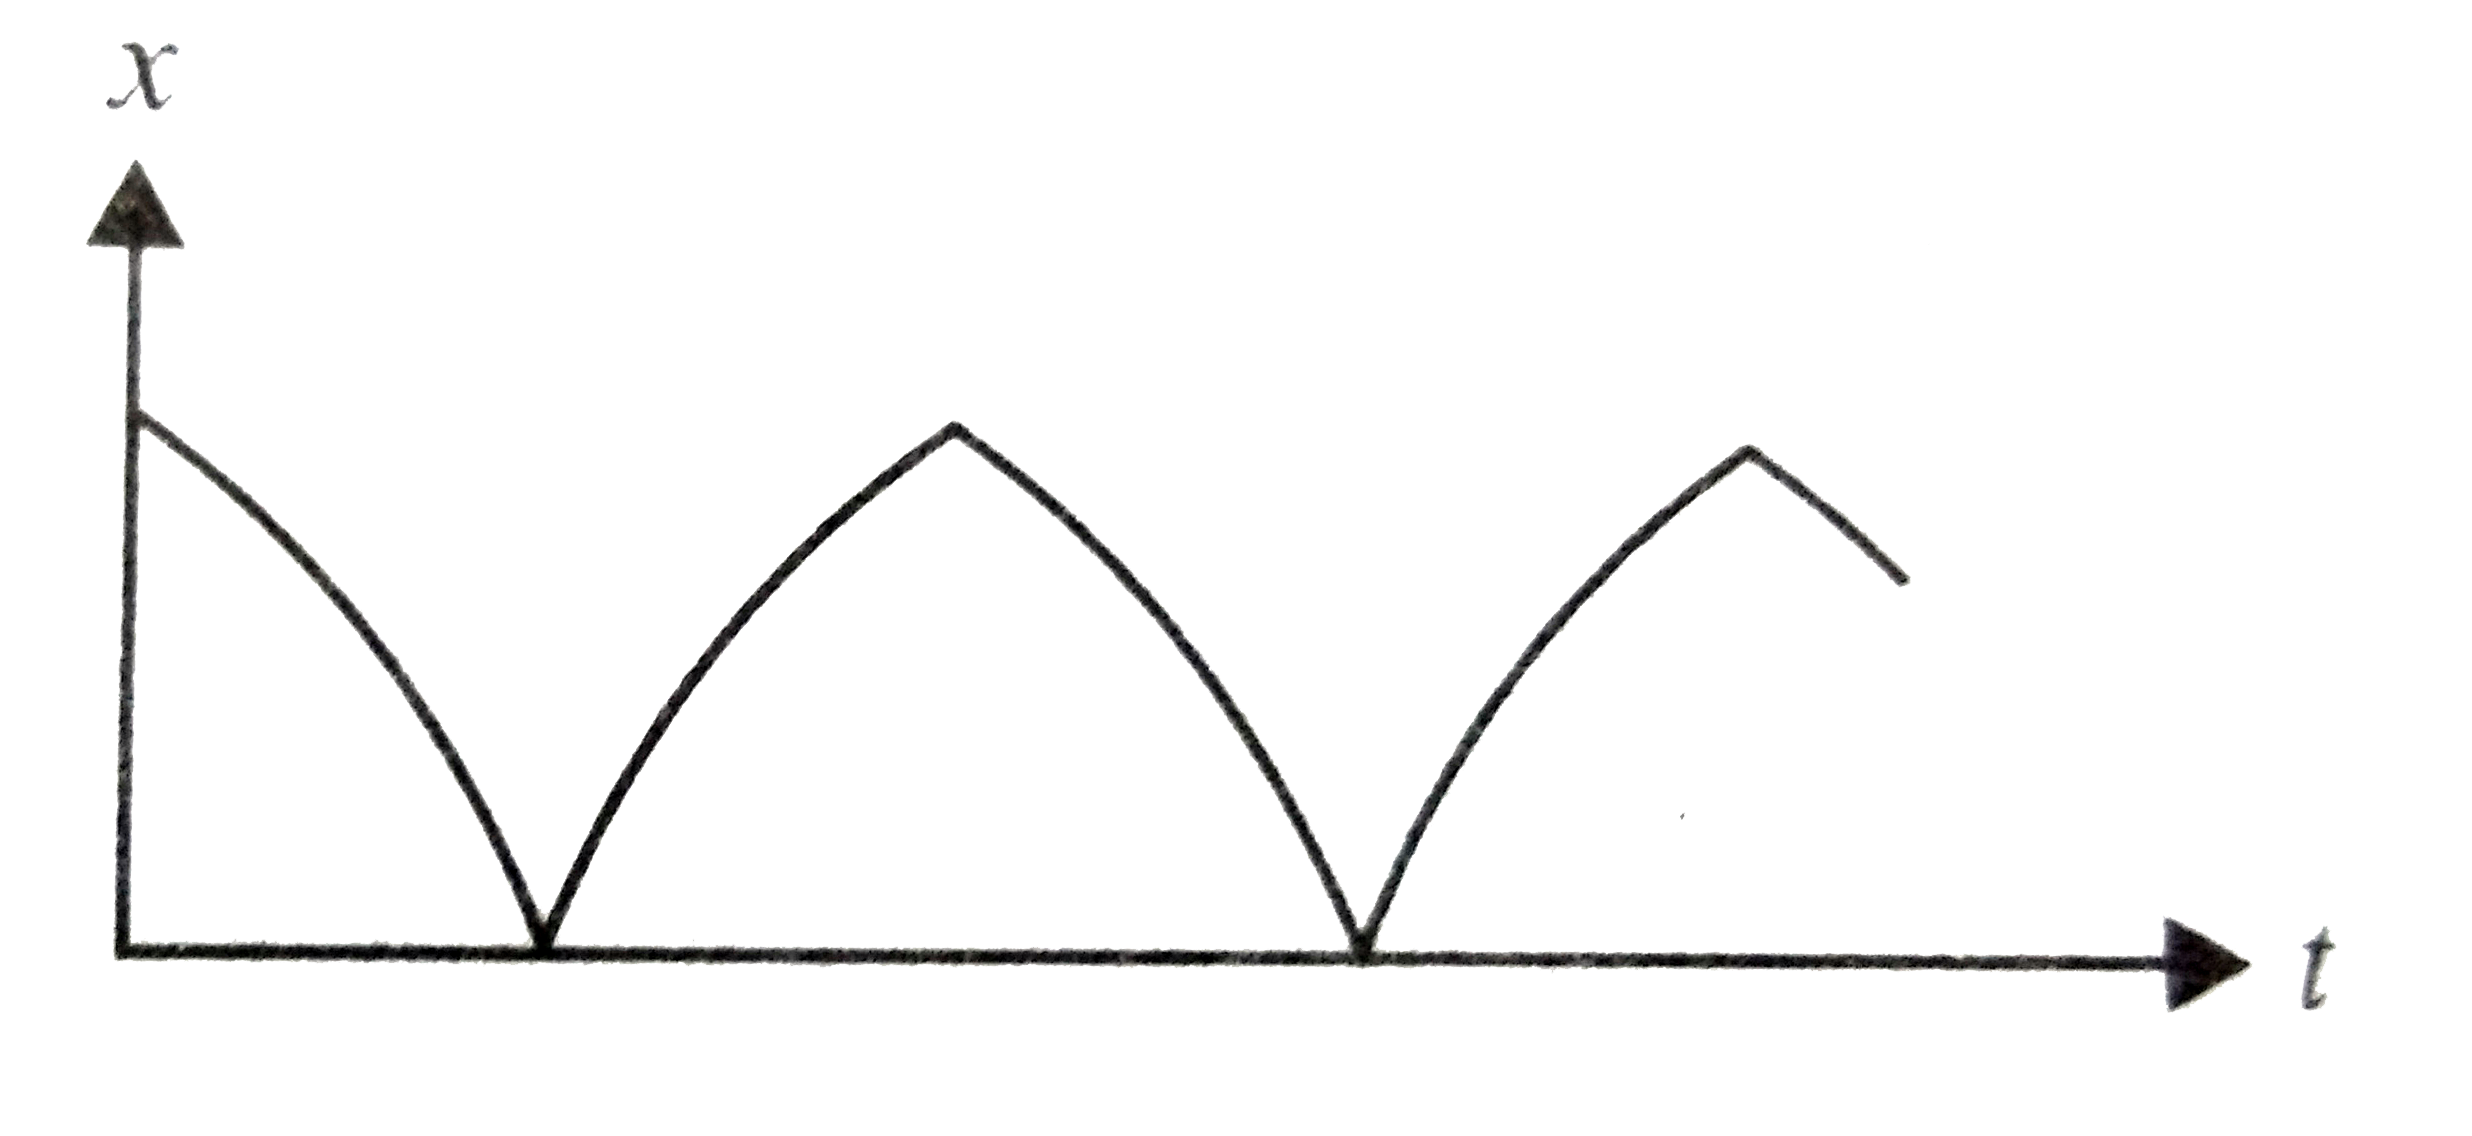
- Question 2 - Select One
Which of the following graphs represents the displacement (s) -time (t) graph for uniform motion ?
A B
B C
C D
D
- Question 3 - Select One
Which of the following graph correctly represents velocity-time relationship for a particle released from rest to fall freely under gravity ?
A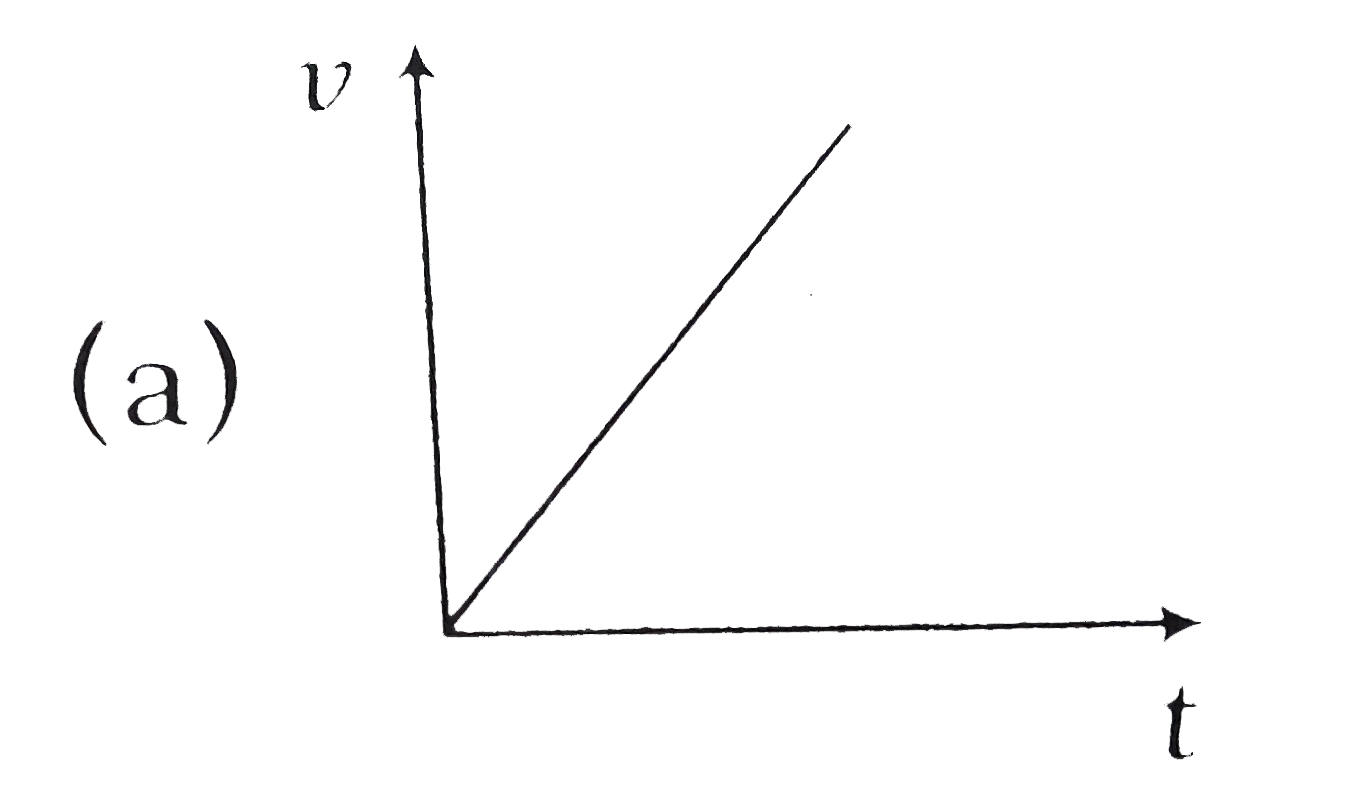 B
B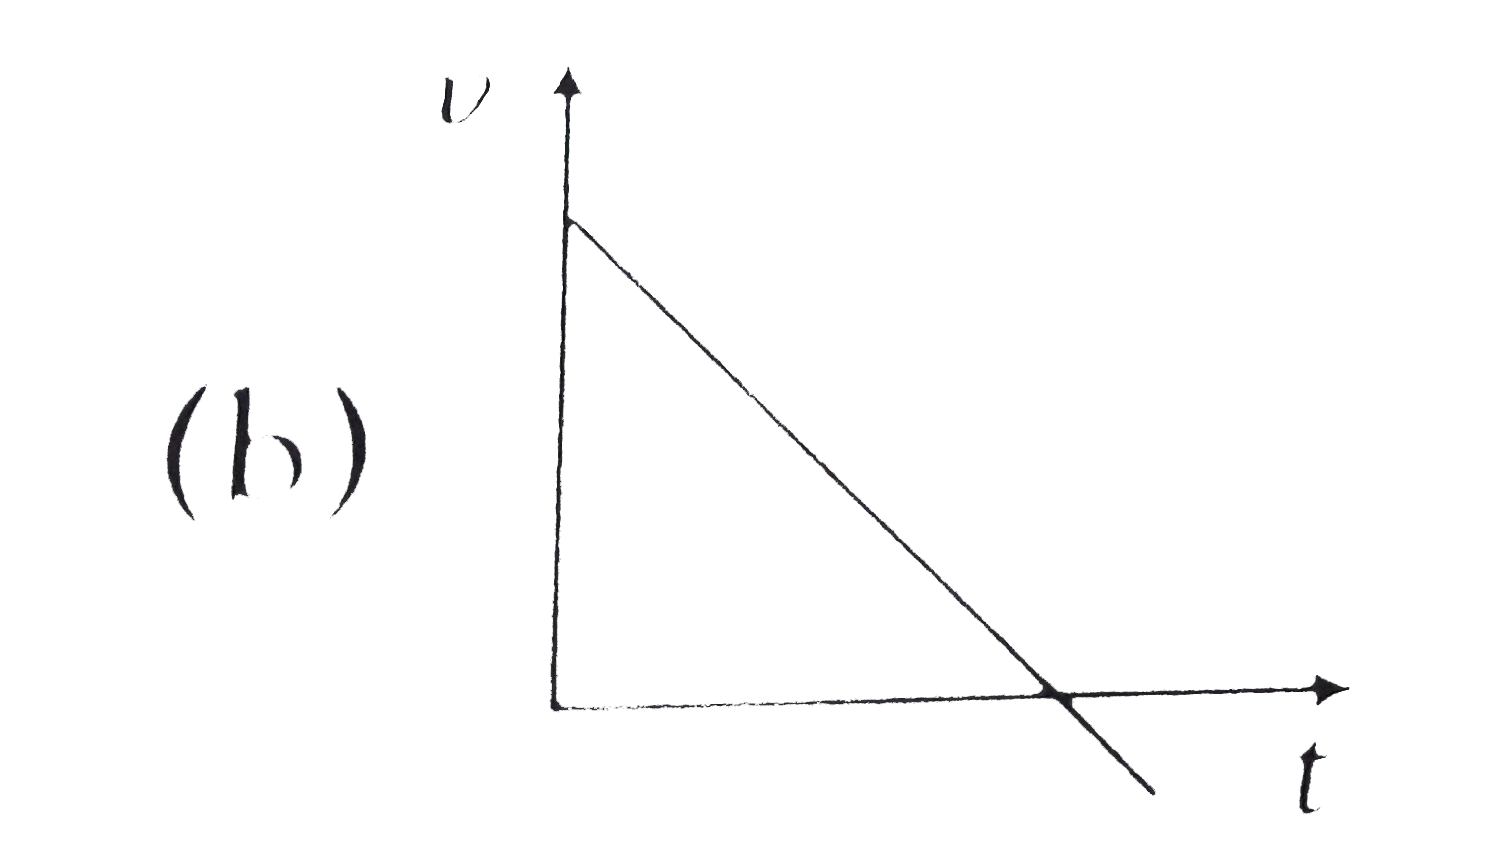 C
C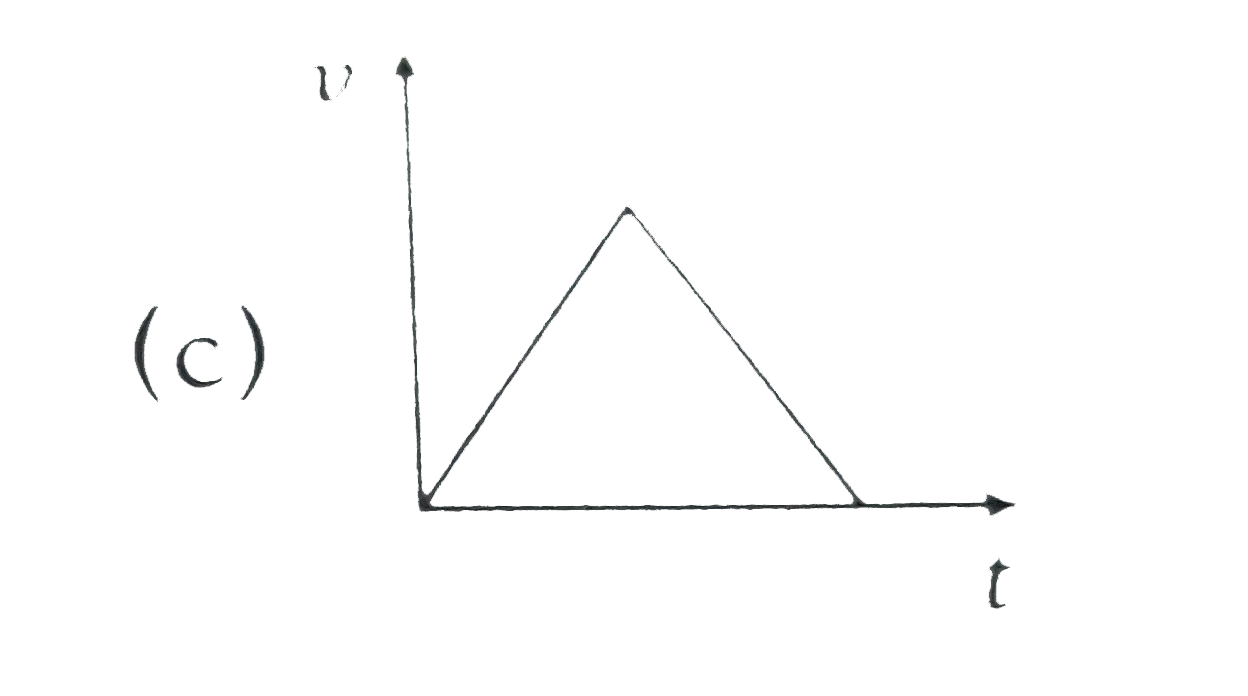 D
D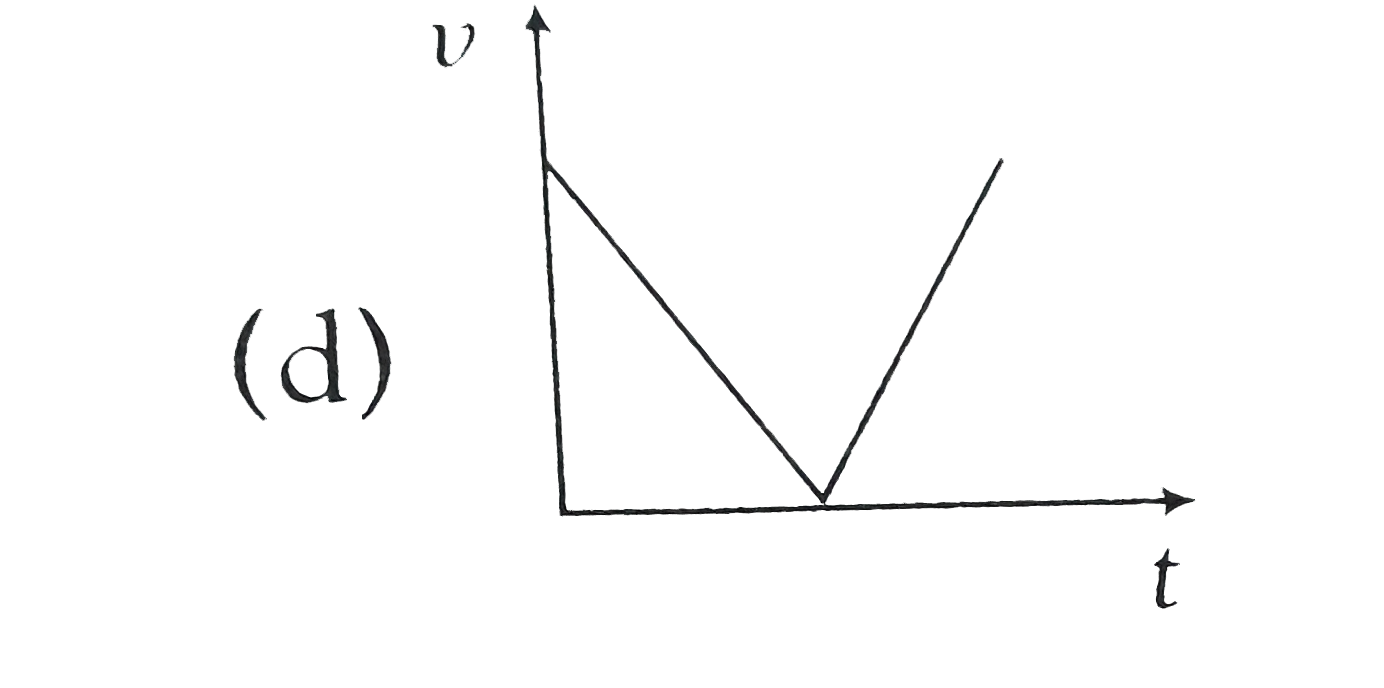
Which of the following represents distance(s)-time(t) graph for a retarded motion?
View SolutionWhich of the following graphs best represents the variation of acceleration 'a' with displacement x?
View Solutionwhich of the following graph represents the variation of resistivity (ρ) with temperature (T) for copper?
View SolutionWhich of the following graphs represent the correct variation of inductive reactance XL with frequency υ?
View SolutionWhich of the following graphs represents the variation of activity (A) of a radioactive substance with time (t).
View Solution

