Thirty children were asked about the number of hours they watched TV programmes in the previous week. The results were found as follows :
 : Make a frequency distribution table for this data, taking class width 5 and one of the class interval as 5— 10Solution in Punjabi
Step by step video & image solution for Thirty children were asked about the number of hours they watched TV programmes in the previous week. The results were found as follows : : Make a frequency distribution table for this data, taking class width 5 and one of the class interval as 5— 10 by Maths experts to help you in doubts & scoring excellent marks in Class 9 exams.
Updated on:21/07/2023Topper's Solved these Questions
- STATISTICSBOOK - NAND LAL PUBLICATIONCHAPTER - STATISTICSEXERCISE - EXERCISE 14.3
1 Videos
- STATISTICSBOOK - NAND LAL PUBLICATIONCHAPTER - STATISTICSEXERCISE - EXERCISE 14.4
6 Videos
- STATISTICSBOOK - NAND LAL PUBLICATIONCHAPTER - STATISTICSEXERCISE - EXERCISE 14.4
6 Videos
- POLYNOMIALSBOOK - NAND LAL PUBLICATIONCHAPTER - POLYNOMIALSEXERCISE - EXERCISE 2.5
44 Videos
- SURFACE AREAS AND VOLUMESBOOK - NAND LAL PUBLICATIONCHAPTER - SURFACE AREAS AND VOLUMESEXERCISE - Exercise 13.9
1 Videos
Similar Questions
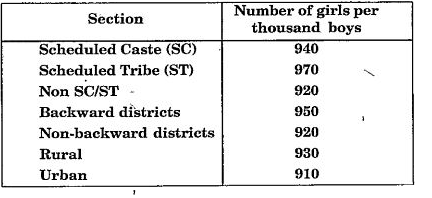
The following data on the number of girls to the nearest ton per thousand boys in different sections of the society is given below:

(i) Represent the information above by a bar graph.
(ii) Write two conclusions you can arrive at from the graph, with justification.
View SolutionThe following number of goals were scored by a team in a series of 10 matches : 2, 3, 4, 5, 0, 1, 3, 3, 4, 3 Find mean, median and mode of these scores :
View SolutionThe following number of goals were scored by a team in a series of 10 matches : 2, 3, 4, 5, 0, 1, 3, 3, 4, 3 Find mean, median and mode of these scores :
View SolutionUse the suitable identity to find the following product : (x+4)(x+10).
View SolutionIf diameter of a sphere is decreased by 25% then what percent does its curved surface area decrease ?
View SolutionThirty children were asked about the number of hours they watched TV programmes in the previous week. The results were found as follows: 1 6 2 3 5 12 5 8 4 810 3 4 12 2 8 15 1 17 63 2 8 5 9 6 8 7 14 12 (i) Make a grouped frequency distribution table for this data, taking class width 5 and one of the class intervals as 5 - 10.(ii) How many children watched television for 15 or more hours a week?
View SolutionHow many lines of symmetry does the above figure have ?
View SolutionWhich of the following are correct chain isomers of butane ? (i)
View SolutionDetermine the point of symmetry of a regular hexagon.
View SolutionDtermine the images of the following figure about the given line :
View SolutionMatch the following Column A to Column B

View SolutionMatch the following Column A to Column B

View SolutionMatch the following Column A to Column B

View SolutionThe inequation represented by the graph given below is :
View SolutionThe inequation that best describes the graph given below is _________
View SolutionThe inequation that best describes the following graph is _________
View Solution
