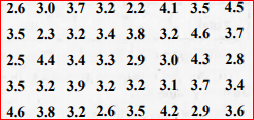
A company manufactures carbatteries of particular type. The lives (in years) of 40 such batteries were recorded as follows :
 Construct a grouped frequency distribution table for this data, using class intervals of size 0.5 starting from the interval 2— 2.5.Solution in Punjabi
Step by step video & image solution for A company manufactures carbatteries of particular type. The lives (in years) of 40 such batteries were recorded as follows : Construct a grouped frequency distribution table for this data, using class intervals of size 0.5 starting from the interval 2— 2.5. by Maths experts to help you in doubts & scoring excellent marks in Class 9 exams.
Updated on:21/07/2023Topper's Solved these Questions
- STATISTICSBOOK - NAND LAL PUBLICATIONCHAPTER - STATISTICSEXERCISE - EXERCISE 14.3
1 Videos
- STATISTICSBOOK - NAND LAL PUBLICATIONCHAPTER - STATISTICSEXERCISE - EXERCISE 14.4
6 Videos
- STATISTICSBOOK - NAND LAL PUBLICATIONCHAPTER - STATISTICSEXERCISE - EXERCISE 14.4
6 Videos
- POLYNOMIALSBOOK - NAND LAL PUBLICATIONCHAPTER - POLYNOMIALSEXERCISE - EXERCISE 2.5
44 Videos
- SURFACE AREAS AND VOLUMESBOOK - NAND LAL PUBLICATIONCHAPTER - SURFACE AREAS AND VOLUMESEXERCISE - Exercise 13.9
1 Videos
Similar Questions
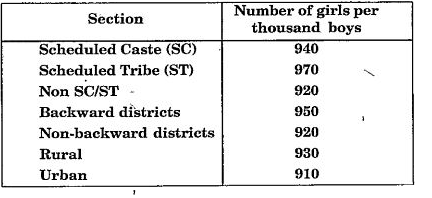
The following data on the number of girls to the nearest ton per thousand boys in different sections of the society is given below:

(i) Represent the information above by a bar graph.
(ii) Write two conclusions you can arrive at from the graph, with justification.
View SolutionThe following number of goals were scored by a team in a series of 10 matches : 2, 3, 4, 5, 0, 1, 3, 3, 4, 3 Find mean, median and mode of these scores :
View SolutionThe following number of goals were scored by a team in a series of 10 matches : 2, 3, 4, 5, 0, 1, 3, 3, 4, 3 Find mean, median and mode of these scores :
View SolutionUse the suitable identity to find the following product : (x+4)(x+10).
View SolutionIf diameter of a sphere is decreased by 25% then what percent does its curved surface area decrease ?
View SolutionFrom the following data, using weighted average method, calculate the cost of living index for the year 2006, taking 2002 as the base year.
ltimg src="https://d10lpgp6xz60nq.cloudfront.net/physics_images/PS_MATH_IX_C18_E03_005_Q01.png" width="80%"gt
View SolutionDetermine the point of symmetry of a regular hexagon.
View SolutionDtermine the images of the following figure about the given line :
View SolutionMatch the following Column A to Column B

View SolutionMatch the following Column A to Column B

View SolutionMatch the following Column A to Column B

View SolutionThe inequation represented by the graph given below is :
View SolutionThe inequation that best describes the graph given below is _________
View SolutionThe inequation that best describes the following graph is _________
View SolutionFrom the following figure, the correct observation is :- ltimg src="https://d10lpgp6xz60nq.cloudfront.net/physics_images/ALN_PHY_R03_E08_015_Q01.png" width="80%"gt
View SolutionA company manufactures car batteries of a particular type. The lives (in years) of 40 such batteries were recorded as follows :
2.63.03.73.22.24.13.54.53.52.33.23.43.83.24.63.72.54.43.43.32.93.04.32.83.53.23.93.23.23.13.73.44.63.83.22.63.54.22.93.6
Construct a grouped frequency distribution table for this data, using class intervals of size 0.5 starting form the intervals 2−2.5
View Solution
