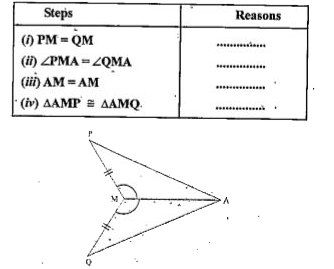
In fig ΔAMP≅ΔAMQ Give reason for the followingsteps.
 Solution in Punjabi
The correct Answer is:(i) Given
(ii) Given
(iii) Common side
(iv) SAS Congruence criterion
Step by step video, text & image solution for In fig DeltaAMP ~=DeltaAMQ Give reason for the followingsteps. by Maths experts to help you in doubts & scoring excellent marks in Class 7 exams.
Topper's Solved these Questions
- BOOK - SWAN PUBLICATIONCHAPTER - CONGRUENCE OF TRIANGLES EXERCISE - Exercise 7.2 (Multiple choice questions )3videos
CONGRUENCE OF TRIANGLES
- BOOK - SWAN PUBLICATIONCHAPTER - CONGRUENCE OF TRIANGLES EXERCISE - OTHER IMPORTANT QUESTIONS (I. Multiple Choice Questions )13videos
CONGRUENCE OF TRIANGLES
- BOOK - SWAN PUBLICATIONCHAPTER - CONGRUENCE OF TRIANGLES EXERCISE - Exercise 7.1 (Trụe/False)2videos
CONGRUENCE OF TRIANGLES
- BOOK - SWAN PUBLICATIONCHAPTER - COMPARING QUANTITIES EXERCISE - OTHER IMPORTANT QUESTION (III. State whether the following statements are true or false:)8videos
COMPARING QUANTITIES
- BOOK - SWAN PUBLICATIONCHAPTER - DATA HANDLINGEXERCISE - OTHER IMPORTANT QUESTIONS (TRUE OR FALSE)8videos
DATA HANDLING
Similar Questions
Which of the following is not a congruence rule
01:37View SolutionTwo angles are congruent if they are:
06:07View SolutionTwo right angles are always congruent:
02:11View SolutionTwo ratios can be compared by converting them into like fraction.
01:31View SolutionA table šlowing the frequency of various observations is called a frequency distribution table. ?
02:45View SolutionHow many lines of symmetry does the above figure have ?
02:17View SolutionWhich of the following are correct chain isomers of butane ? (i)
05:41View SolutionDetermine the point of symmetry of a regular hexagon.
02:21View SolutionDtermine the images of the following figure about the given line :
02:03View SolutionMatch the following Column A to Column B
 02:10View Solution
Match the following Column A to Column B
 02:17View Solution
Match the following Column A to Column B
 02:10View Solution
Find the area of the figure given below.
 04:23View Solution
The area of the shaded part in the figure given below is ______.
 01:13View Solution
The inequation represented by the graph given below is :
03:12View SolutionThe inequation that best describes the graph given below is _________
03:10View Solution

