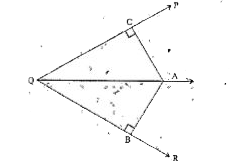
In given figure . Prove that
 Solution in Punjabi
Step by step video & image solution for In given figure ABbotQR,AC botQP and QC = QB . Prove that angleAQB=angleAQC by Maths experts to help you in doubts & scoring excellent marks in Class 7 exams.
Updated on:21/07/2023Topper's Solved these Questions
- CONGRUENCE OF TRIANGLES BOOK - SWAN PUBLICATIONCHAPTER - CONGRUENCE OF TRIANGLES EXERCISE - Exercise 7.2 (Multiple choice questions )
3 Videos
- CONGRUENCE OF TRIANGLES BOOK - SWAN PUBLICATIONCHAPTER - CONGRUENCE OF TRIANGLES EXERCISE - OTHER IMPORTANT QUESTIONS (I. Multiple Choice Questions )
13 Videos
- CONGRUENCE OF TRIANGLES BOOK - SWAN PUBLICATIONCHAPTER - CONGRUENCE OF TRIANGLES EXERCISE - Exercise 7.1 (Trụe/False)
2 Videos
- COMPARING QUANTITIES BOOK - SWAN PUBLICATIONCHAPTER - COMPARING QUANTITIES EXERCISE - OTHER IMPORTANT QUESTION (III. State whether the following statements are true or false:)
8 Videos
- DATA HANDLINGBOOK - SWAN PUBLICATIONCHAPTER - DATA HANDLINGEXERCISE - OTHER IMPORTANT QUESTIONS (TRUE OR FALSE)
8 Videos
Similar Questions
Which of the following is not a congruence rule
View SolutionTwo angles are congruent if they are:
View SolutionTwo right angles are always congruent:
View SolutionTwo ratios can be compared by converting them into like fraction.
View SolutionA table šlowing the frequency of various observations is called a frequency distribution table. ?
View SolutionHow many lines of symmetry does the above figure have ?
View SolutionDetermine the point of symmetry of a regular hexagon.
View SolutionDtermine the images of the following figure about the given line :
View SolutionMatch the following Column A to Column B

View SolutionMatch the following Column A to Column B

View SolutionMatch the following Column A to Column B

View SolutionFind the area of figure given below.

View SolutionFind the perimeter of the figure given below.

View SolutionFind the area of the figure given below.

View SolutionThe area of the shaded part in the figure given below is ______.

View SolutionThe inequation represented by the graph given below is :
View Solution
