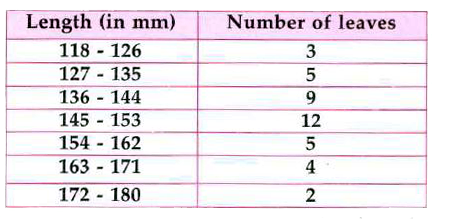
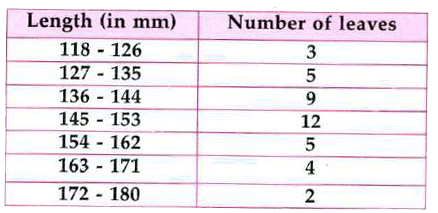
The lengths of 40 leaves of a plant are measured correct to the nearest millimetre, and the data obtained is represented in the following table :
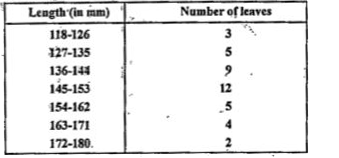
Find the median length of the leaves.
The correct Answer is:146⋅75 mm
Topper's Solved these Questions
- STATISTICS BOOK - SWAN PUBLICATIONCHAPTER - STATISTICS EXERCISE - Exercise 14.4
1 Videos
- STATISTICS BOOK - SWAN PUBLICATIONCHAPTER - STATISTICS EXERCISE - Exercise 14.2
6 Videos
- Some Applications of TrigonometryBOOK - SWAN PUBLICATIONCHAPTER - Some Applications of TrigonometryEXERCISE - EXERCISE 9.1
14 Videos
- SURFACE AREAS AND VOLUMES BOOK - SWAN PUBLICATIONCHAPTER - SURFACE AREAS AND VOLUMES EXERCISE - EXERCISE 13.5(Optional)
7 Videos
Similar Questions
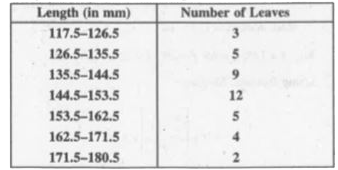
The lengths of 40 leaves of a plant are measured correct to the nearest millimeter and the data obtained is represented in the following table :
Find the median length of the leaves.
View SolutionThe lengths of 40 leaves of a plant are measured correct to the nearest millimetre, and the data obtained is represented in the following table: Length (in mm): 118-126 127-135 136-144 145-153 154-162 163-171 172-180 No. of leaves: 3 5 9 12 5 4 2 Find the mean length of leaf.
View SolutionThe lengths of 40 leaves of a plant are measured correct to the nearest millimetre, and the data obtained is represented in the following table: Length (mm): 118-126 127-135 136-144 145-153 154-162 163-171 172-180 No. of leaves: 3 5 9 12 5 4 2. Find the mean length of leaf.
View SolutionThe length of 40 leaves of a plant are measured correct to one millimeter, and the obtained data is represented in the following table:
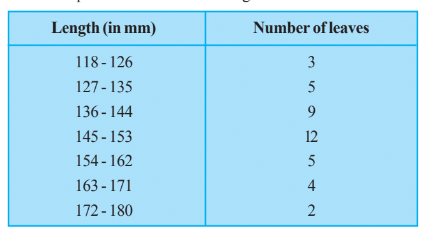
(i) Draw a histogram to represent the given data.
(ii) Is there any other suitable graphical representation for the same data?
(iii) Is it correct to conclude that the maximum number of leaves are 153 mm long?Why?
View SolutionThe length of 40 leaves of a plant are measured correct to one millimetre, and the obtained data is represented in the following table:
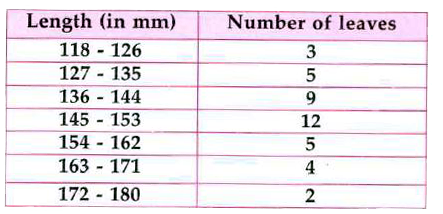
Is there any other suitable graphical representation for the same data?
View SolutionThe length of 40 leaves of a plant are measured correct to one millimetre, and the obtained data is represented in the following table:
Is it correct to conclude that the maximum number of leaves are 153 mm long? Why?
View SolutionThe length of 40 leaves of a plant are measured correct to one millimetre, and the obtained data is represented in the following table:
Draw a histogram to represent the given data. [Hint: First make the class intervals continuous]
View SolutionThe length of 40 leaves of a plant are measured correct to one millimetre, and the obtained data is represented in the following table: (i) Draw a histogram to represent the given data.(ii) Is there any other suitable graphical representation for the same data?(iii) Is it correct to conclude that the maximum number of leaves are 153 mm long?Why?
View SolutionThe length of 40 leaves of a plant measured correct to one millimetre and the obtained data is represented in the following table:

(i) Draw a histogram to represent the given data.
(ii) Is there any other suitable graphical representation for the same data?
(iii) Is it correct to conclude that the maximum number of leaves 153 mm long and why?
View SolutionThe length of 40 leaves of a plant are measured correct to nearest millimetres. The data obtained is as follows :

Draw histogram to represent the given data.
View Solution
