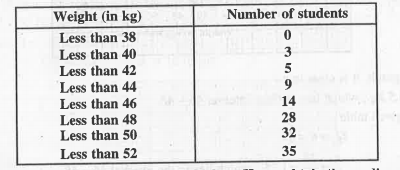
The distribution below gives the weights of 30 students of a class. Find the median weight of the students.
 Solution in Punjabi
The correct Answer is:65⋅67 kg
Step by step video, text & image solution for The distribution below gives the weights of 30 students of a class. Find the median weight of the students. by Maths experts to help you in doubts & scoring excellent marks in Class 10 exams.
Updated on:21/07/2023Topper's Solved these Questions
- STATISTICS BOOK - SWAN PUBLICATIONCHAPTER - STATISTICS EXERCISE - Exercise 14.4
1 Videos
- STATISTICS BOOK - SWAN PUBLICATIONCHAPTER - STATISTICS EXERCISE - Exercise 14.2
6 Videos
- Some Applications of TrigonometryBOOK - SWAN PUBLICATIONCHAPTER - Some Applications of TrigonometryEXERCISE - EXERCISE 9.1
14 Videos
- SURFACE AREAS AND VOLUMES BOOK - SWAN PUBLICATIONCHAPTER - SURFACE AREAS AND VOLUMES EXERCISE - EXERCISE 13.5(Optional)
7 Videos
Similar Questions
During the medial check up of 35 students of a class, their weights were recorded as follows:

Draw a less than type ogive for the given data. Hence obtain the median weight from the graph and verify the result by using the formula.
View SolutionThe following table shows the ages of the partients admitted in a hospital during a year :

Find the mode and the mean of the data given above. Compare and interpret the two measures of central tendency.
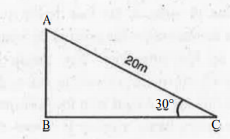
View SolutionA circus artist is climbing a 20m long rope, which is tightly stretched and tied from the top of a vertical pole to the ground. Find the height of the pole, if the angle made by the rope with the ground level is 30∘ (see fig.).

View SolutionA copper wire 3 mm in diameter is wound about a cylinder whose length is 12 cm, and diameter 10 cm,so as to cover the curved surface of the cylinder. Find the length and mass of the wire, assuming the density of copper to 8.88 g per cm3.
View SolutionDetermine the point of symmetry of a regular hexagon.
View SolutionDtermine the images of the following figure about the given line :
View SolutionMatch the following Column A to Column B

View SolutionMatch the following Column A to Column B

View SolutionMatch the following Column A to Column B

View SolutionFind the area of figure given below.

View SolutionFind the perimeter of the figure given below.

View SolutionFind the area of the figure given below.

View SolutionThe area of the shaded part in the figure given below is ______.

View SolutionThe inequation represented by the graph given below is :
View SolutionThe inequation that best describes the graph given below is _________
View SolutionThe inequation that best describes the following graph is _________
View Solution
