Which of the following shaded regions shows the graph of the inequality y≤|x+2| ?
A
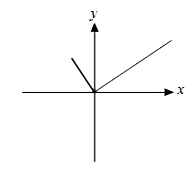
B
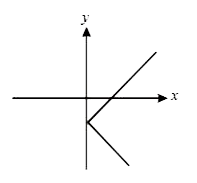
C
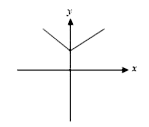
D
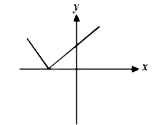
Video Solution
Text Solution
The correct Answer is:D
|
Answer
Step by step video, text & image solution for Which of the following shaded regions shows the graph of the inequality y le |x + 2| ? by Maths experts to help you in doubts & scoring excellent marks in Class 14 exams.
Updated on:21/07/2023
Topper's Solved these Questions
- BOOK - DISHA PUBLICATIONCHAPTER - INEQUALITIESEXERCISE - Practice Exercises (Expert Level)11videos
INEQUALITIES
- BOOK - DISHA PUBLICATIONCHAPTER - INEQUALITIESEXERCISE - Test Yourself15videos
INEQUALITIES
- BOOK - DISHA PUBLICATIONCHAPTER - INEQUALITIESEXERCISE - Practice Exercises (Foundation Level)14videos
INEQUALITIES
- BOOK - DISHA PUBLICATIONCHAPTER - GEOMETRY EXERCISE - TEST YOURSELF3videos
GEOMETRY
- BOOK - DISHA PUBLICATIONCHAPTER - INTERESTEXERCISE - Test Yourself15videos
INTEREST
Similar Questions
Knowledge Check
- Question 1 - Select One
The graph of the inequality 4x+6y≤24 is :
Ahalf plane that contains the origin, including the points on the line 4x+6y=24.Bhalf plane that does not contain the origin.Centire XOY plane.Dhalf plane that contains the origin. - Question 2 - Select One
The graph of inequality 3x+y≤3 is:
Aclosed half plane that contains the origin.Bopen half plane that contains the origin.Copen half plane not containing the origin.Dclosed half plane not containing the origin. - Question 3 - Select One
The shaded region is represented by the inequality:
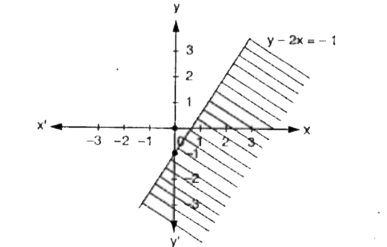 Ay−2x≤−1Bx−2y≤−1Cy−2x≥−1Dx−2y≥−1
Which of the following inequations represents the shaded region?
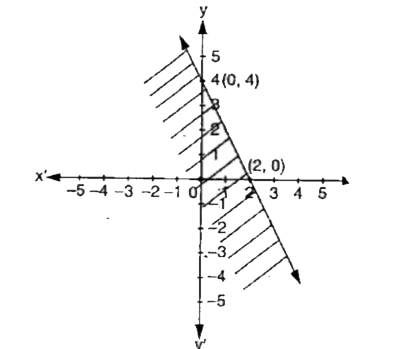 View Solution
The shaded region for the inequality x+5y≤6 is
View SolutionThe shaded region is represented by the inequation:
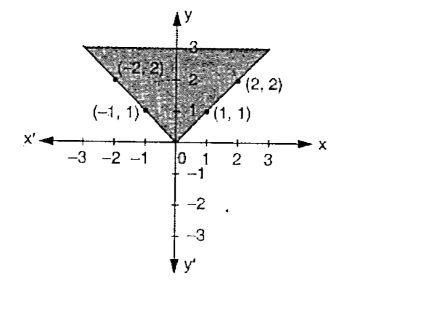 View Solution
The shaded region for the inequality x+5y≤6 is
View SolutionWhich shows the solution to the inequality −3.5x−12≤58?
View Solution
