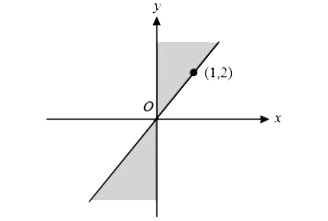
The shaded portion of figure shows the graph of which of the following ?
A
B
C
D
Video Solution
Text Solution
The correct Answer is:A
|
Answer
Step by step video, text & image solution for The shaded portion of figure shows the graph of which of the following ? by Maths experts to help you in doubts & scoring excellent marks in Class 14 exams.
Updated on:21/07/2023
Topper's Solved these Questions
- BOOK - DISHA PUBLICATIONCHAPTER - INEQUALITIESEXERCISE - Practice Exercises (Expert Level)11videos
INEQUALITIES
- BOOK - DISHA PUBLICATIONCHAPTER - INEQUALITIESEXERCISE - Test Yourself15videos
INEQUALITIES
- BOOK - DISHA PUBLICATIONCHAPTER - INEQUALITIESEXERCISE - Practice Exercises (Foundation Level)14videos
INEQUALITIES
- BOOK - DISHA PUBLICATIONCHAPTER - GEOMETRY EXERCISE - TEST YOURSELF3videos
GEOMETRY
- BOOK - DISHA PUBLICATIONCHAPTER - INTERESTEXERCISE - Test Yourself15videos
INTEREST
Similar Questions
Knowledge Check
- Question 1 - Select One
The shaded portion represents.
AA group of professional peopleBA group of Engineers and Professors who are Lawyers
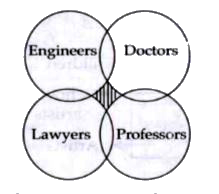 CA group of Engineers and Lawyers who are also Doctors and Professors a·s well.DNone of these
 - Question 2 - Select One
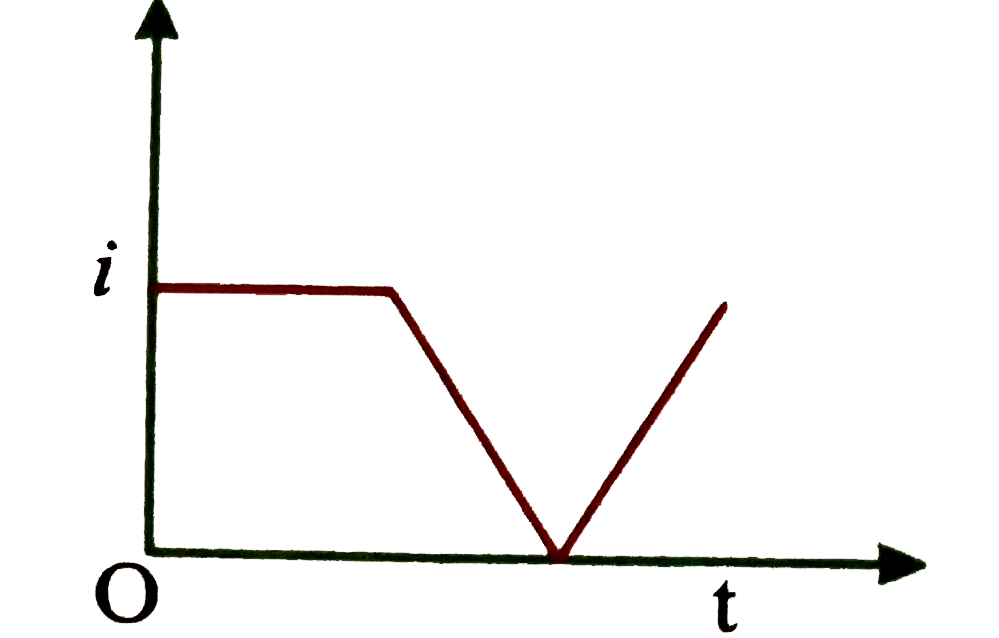
The current i in an induction coil varies with time according to the graph shown in figure. Which of the following graph shows induced emf in the coil with time:
A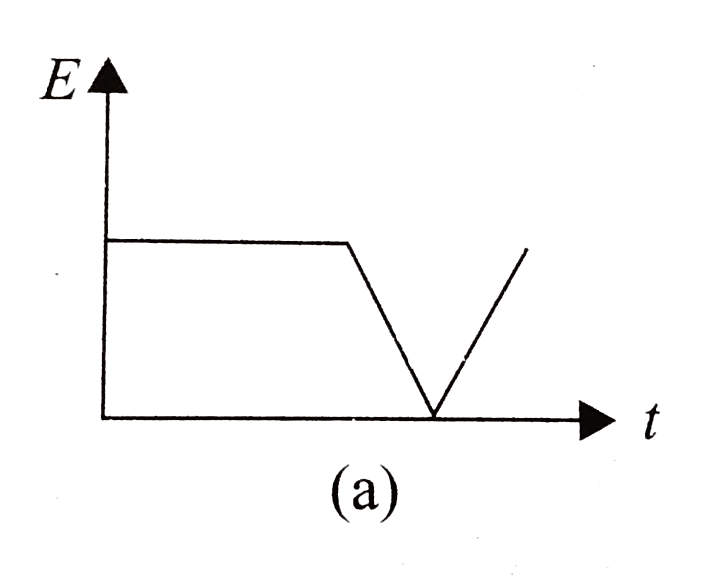 B
B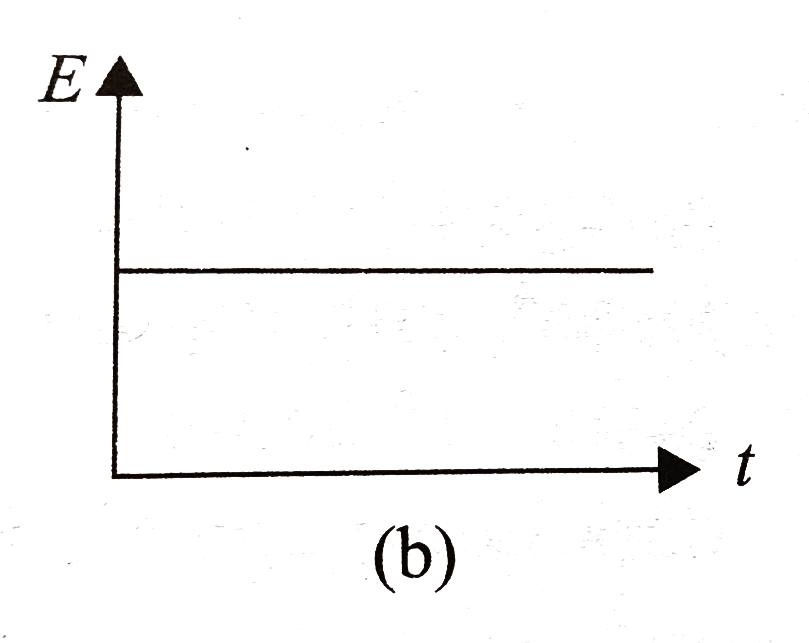 C
C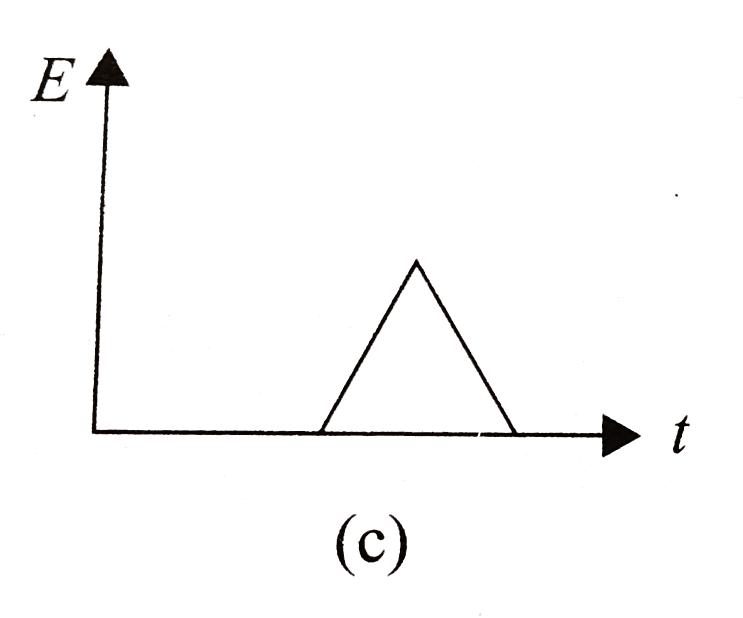 D
D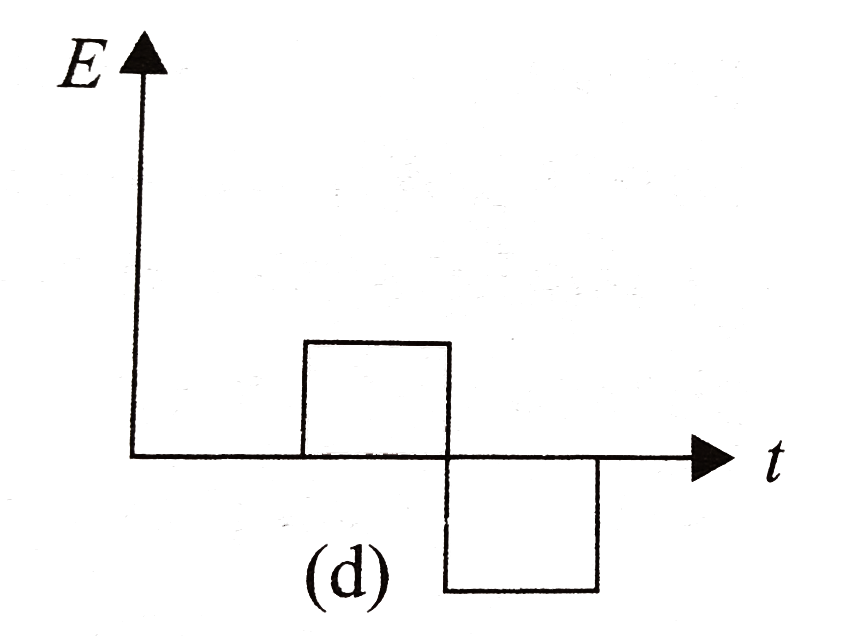
- Question 3 - Select One
The current is an induction coil varies with time t, according to the graph shown in figure. Which of the following graphs shows the induced emf (e) in the coil with time.
 A
A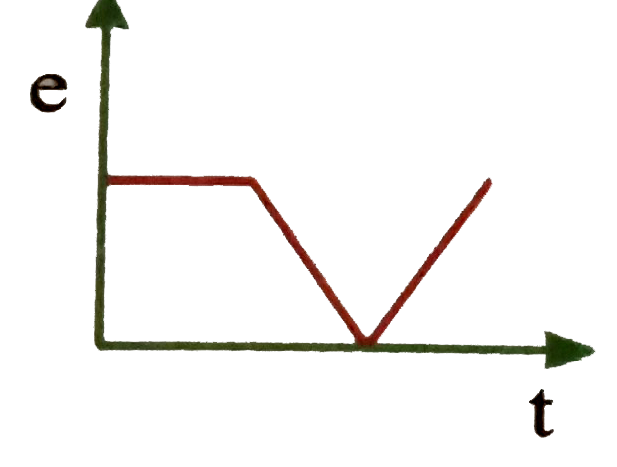 B
B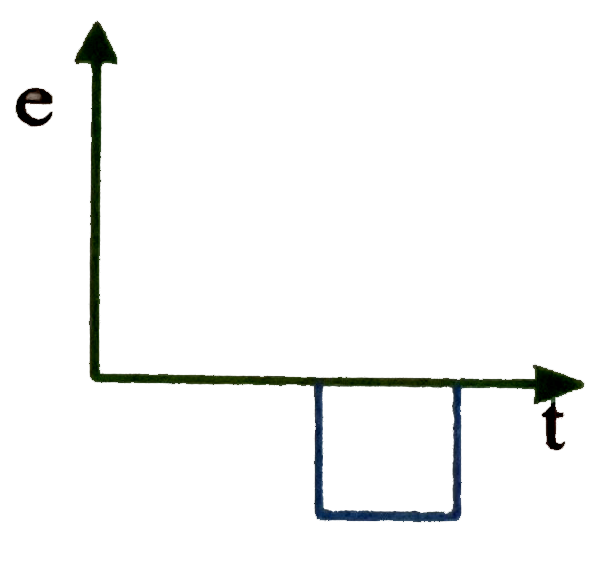 C
C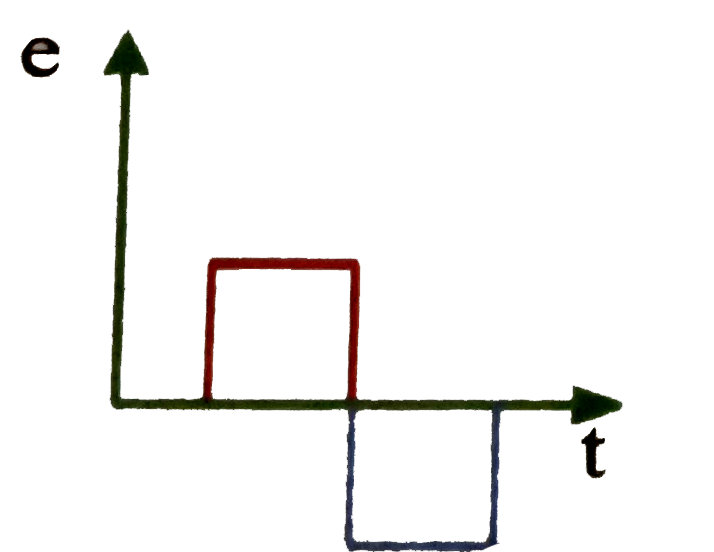 D
D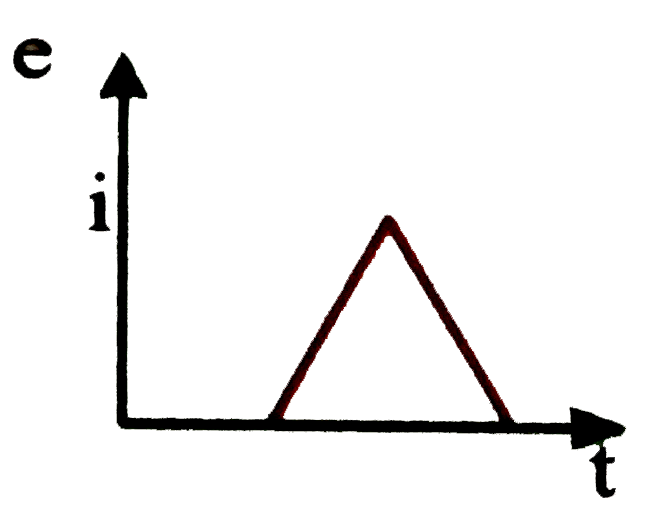
The figure shows a hypthetical tetrapeptide portion of a protein with parts labelled A-D. Which one of the following option is correct
 View Solution
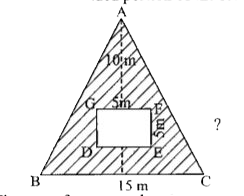
The area of the shaded portion in the figure is
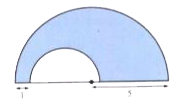 View Solution
The area of the shaded portion of the graph represents :
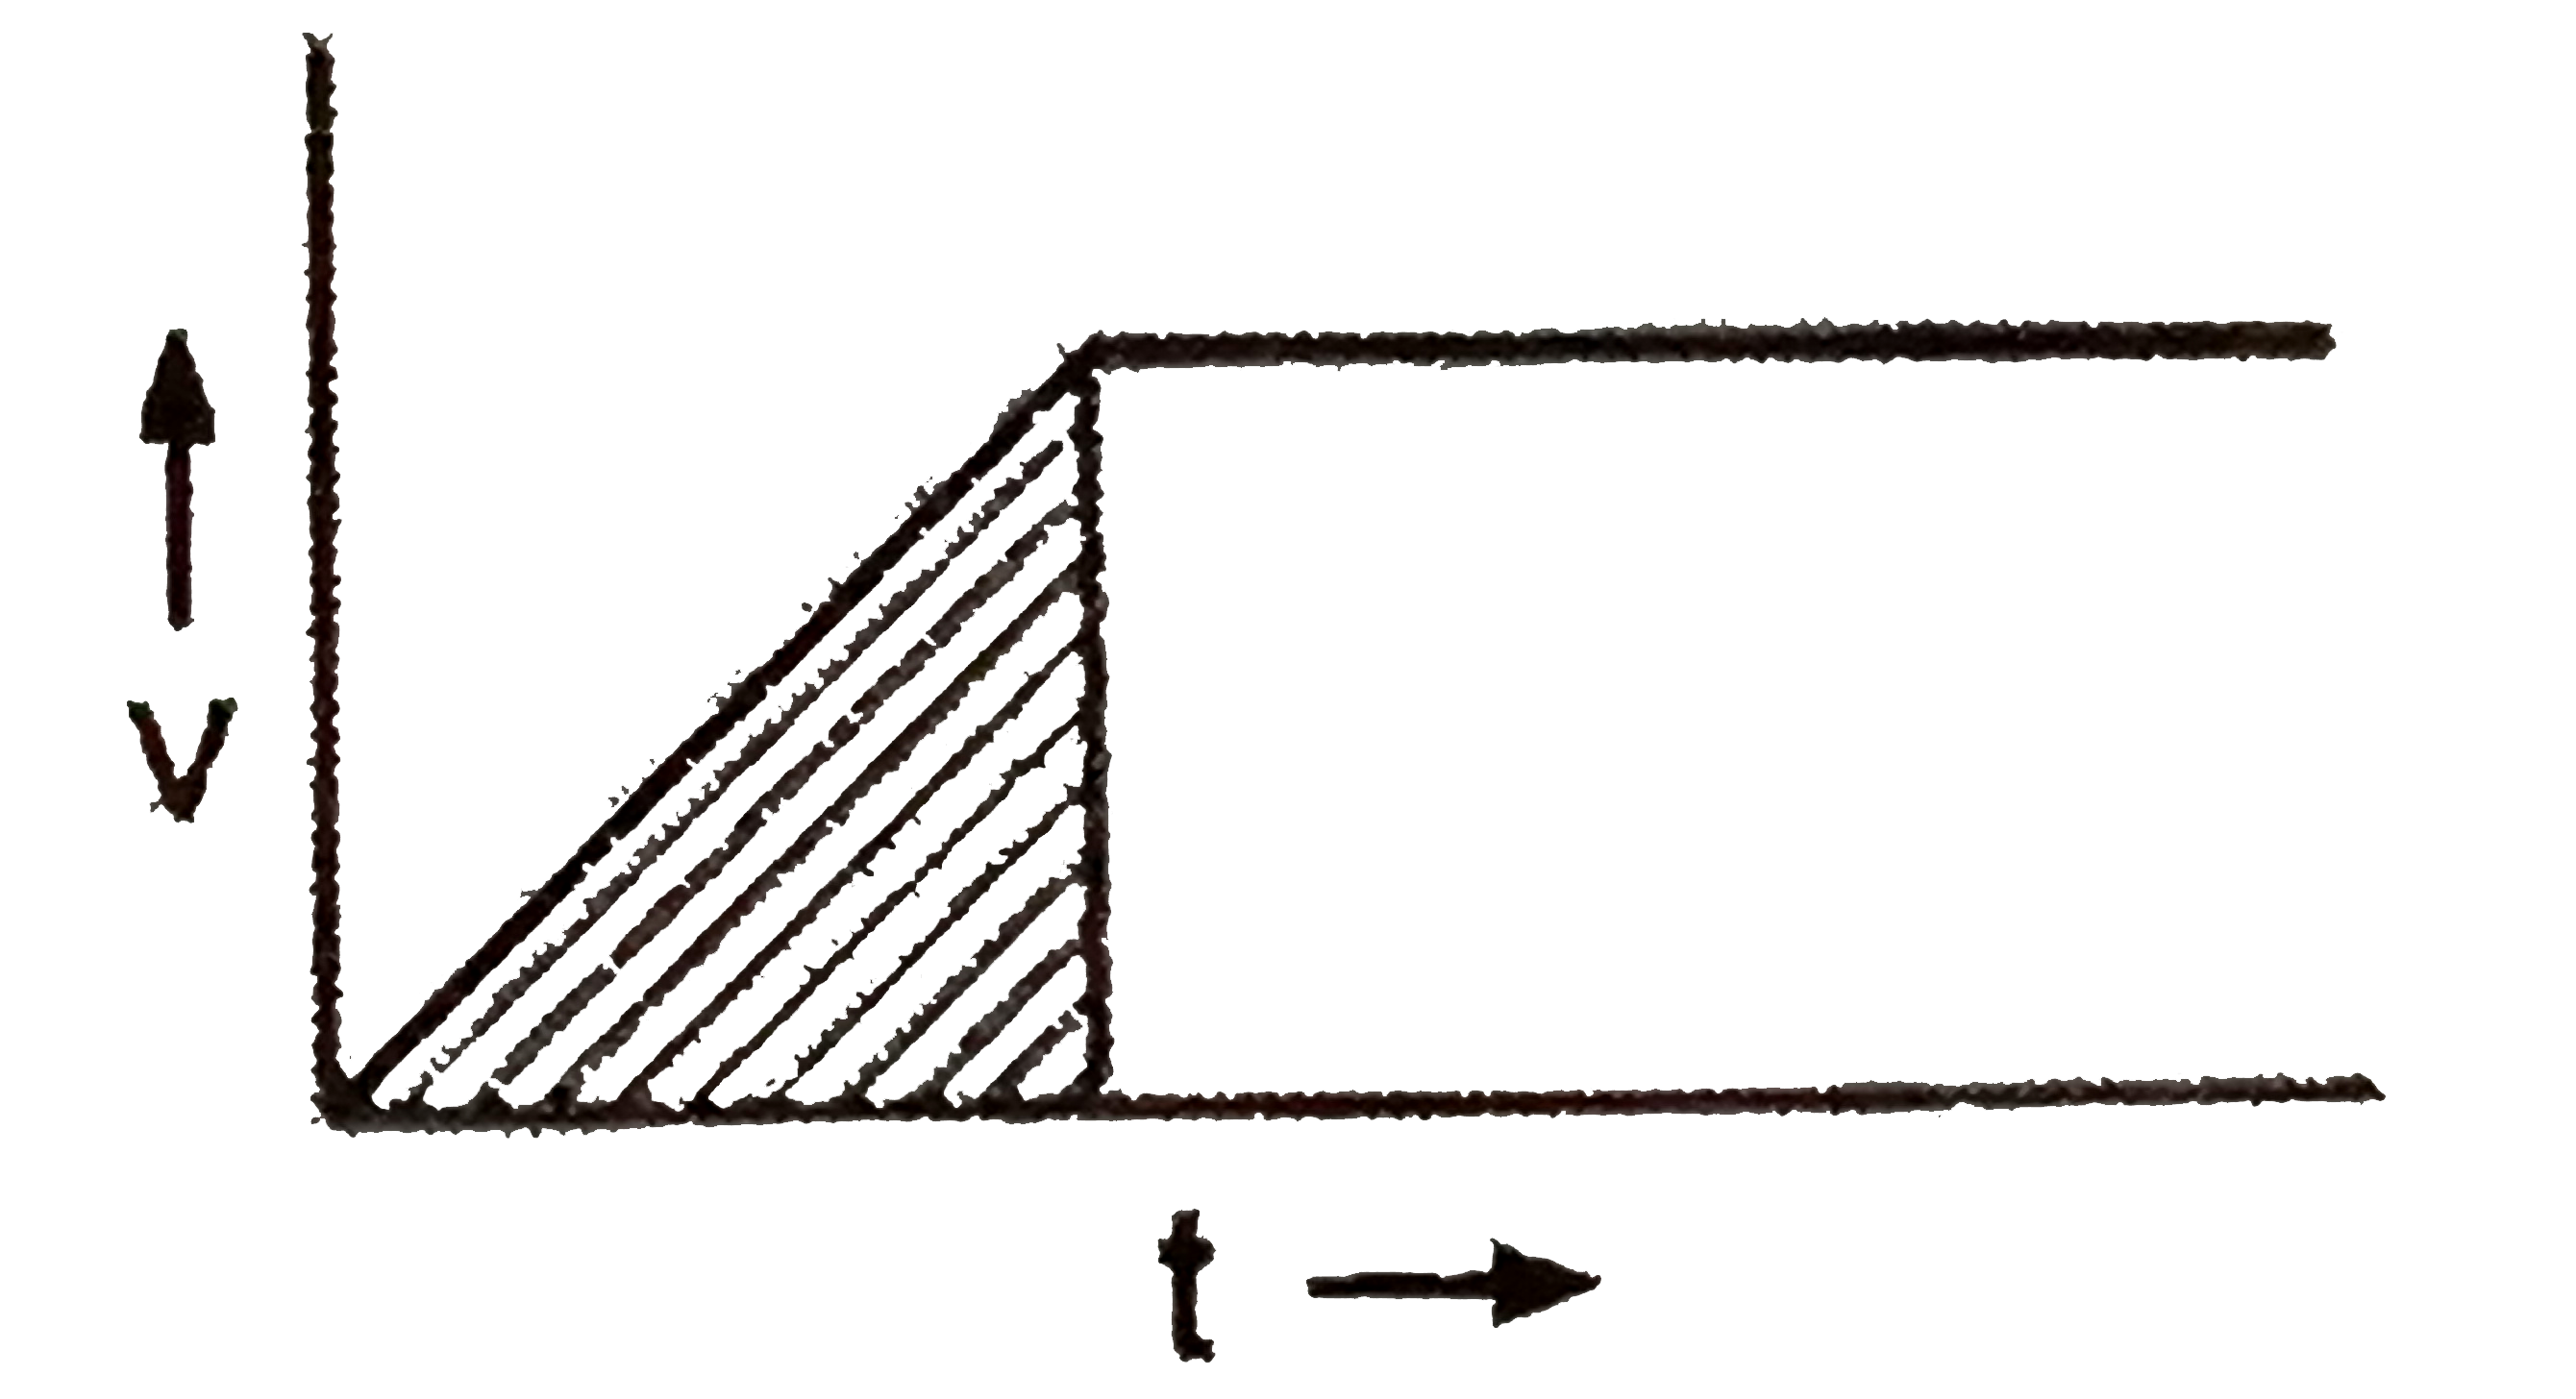 View Solution
The area of the shaded portion of the graph represents
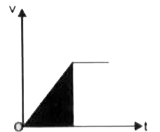 View Solution
The figure shows a tetrapeptide hypothetical portion of a protein with parts labeleld a-d. Which one of the following option is correct ?
 View Solution


