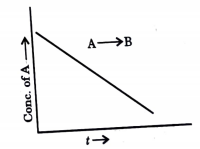
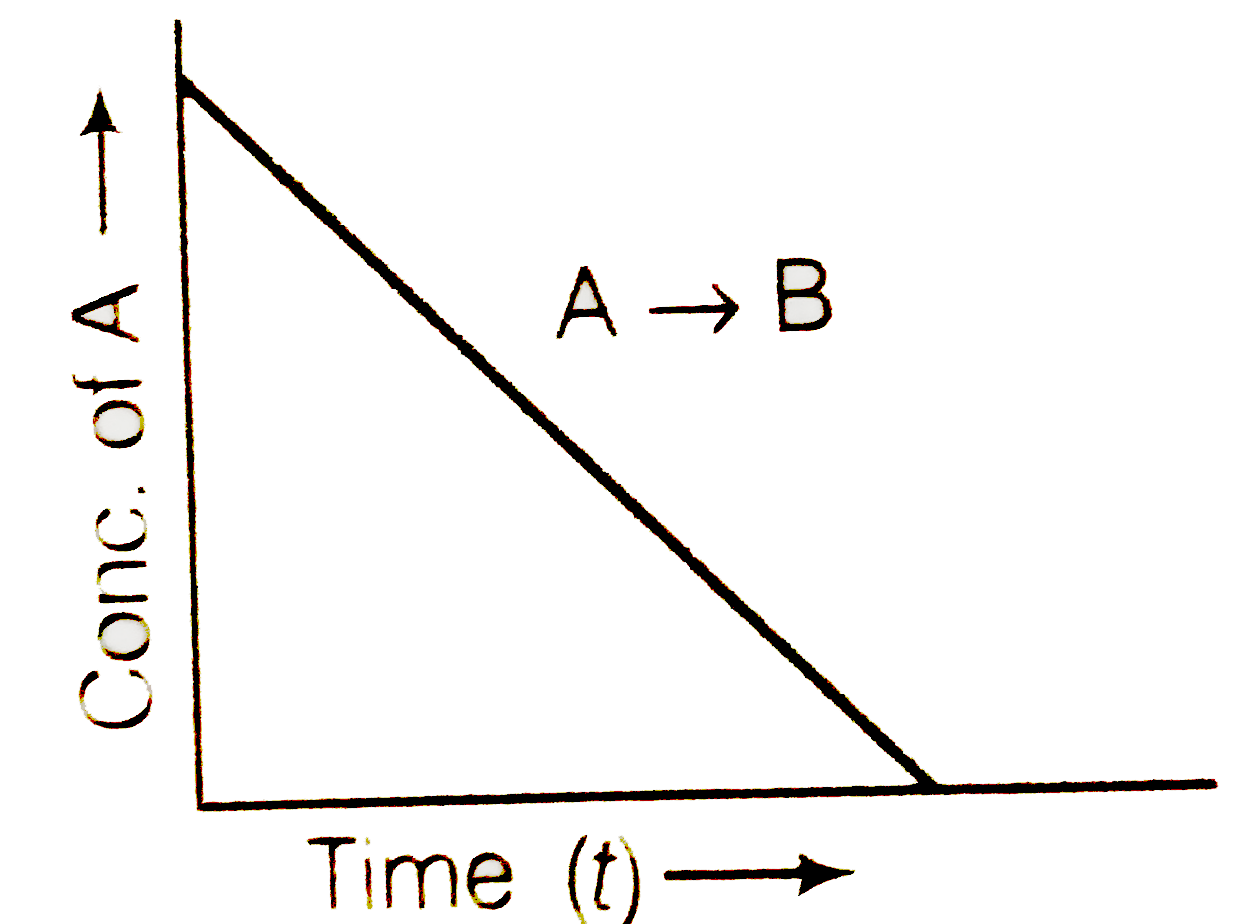
For a general reaction A → B, plot of concentration of A vs time is given in figure below. Answer the following question on the basis of this graph.

What is the slope of the curve?Solution in Punjabi
Step by step video & image solution for For a general reaction A rarr B, plot of concentration of A vs time is given in figure below. Answer the following question on the basis of this graph. What is the slope of the curve? by Chemistry experts to help you in doubts & scoring excellent marks in Class 12 exams.
Updated on:21/07/2023Topper's Solved these Questions
- CHEMICAL KINETICSBOOK - MODERN PUBLICATIONCHAPTER - CHEMICAL KINETICSEXERCISE - EXERCISE
531 Videos
- BIOMOLECULESBOOK - MODERN PUBLICATIONCHAPTER - BIOMOLECULESEXERCISE - EXERCISE
503 Videos
- CHEMISTRY IN EVERYDAY LIFEBOOK - MODERN PUBLICATIONCHAPTER - CHEMISTRY IN EVERYDAY LIFEEXERCISE - EXERCISE
352 Videos
Similar Questions
How can we express the rates of following reactions in terms of concentration of reactants and products ?
2O3↔3O2
View SolutionComplete the following statement- Uses for solder are-
View SolutionTrue or False : Equanil, used as tranquilizer, is a derivative of barbituric acid.
View SolutionThe plot of concentration of the reactant vs time for a reaction is a straight line with a negative slope. This reaction follows
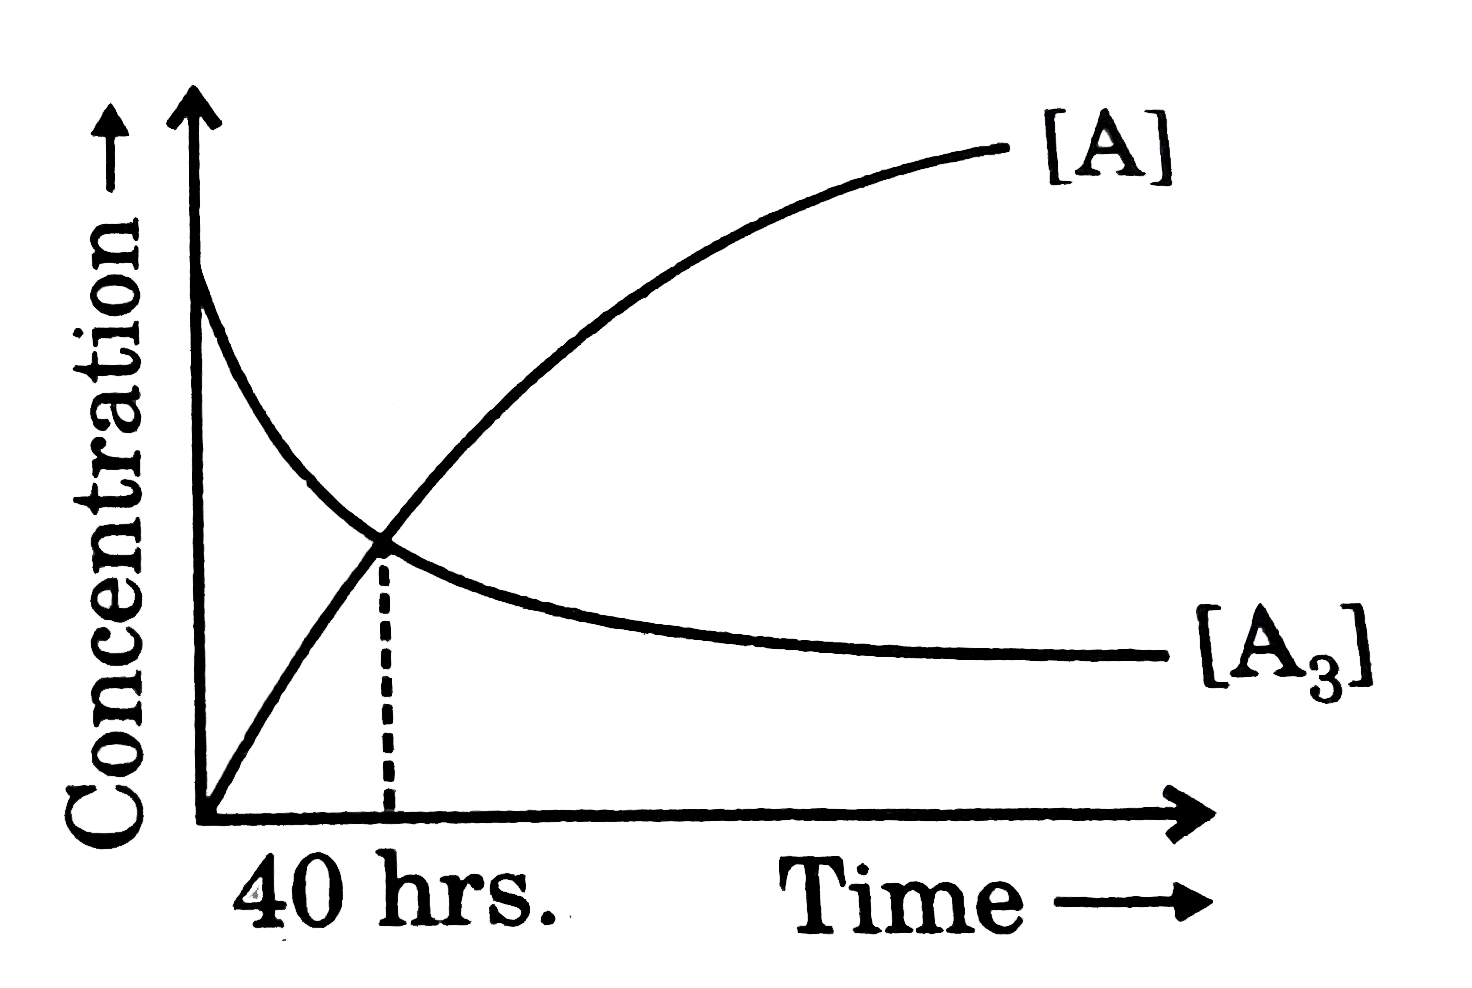
View SolutionFor a first order reaction: A3→3A, Following graph is observed when concentration vs. time graph is plotted. Identify the option which is correct.

View SolutionFor a general reaction A to B. plot of concentrating of A vs time is given in fig. Answer the following questions on the basis of this graph. a) What is the order of the reaction? b) What is the slope of the curve? c) What are the units of rate constant?
View SolutionFor a general reaction A→B, plot of concentration of A vs time is given in figure. Answer the following questions on the basis of this graph.
(i) what is the order of the reaction?
(ii) What is the slope of the curve ?
(iii) What are the units of rate constant?

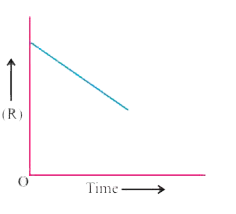
View SolutionFor chemical reaction R rarr P the variation in the concentration (R ) vs .Time (t) plot given as (i) predict the order of the reaction (ii) what is he slope of the curve?
View SolutionThe plot of a concentration of the reactant vs time for a reaction is a straight line with a negative slope. The reaction follows a -
View Solutionplot a graph of reaction -rate vs concentration of the reactant for a fist order reaction.
View SolutionFor a chemical reaction R → P, the variation in the concentration (R) vs time (t) plot is given :

What is the slope of the curve ?
View SolutionFor a general reaction A→B, plot of concentration of A vs time is given in figure. Answer the following questions on the basis of this graph.
(i) what is the order of the reaction?
(ii) What is the slope of the curve ?
(iii) What are the units of rate constant?

View SolutionFor chemical reaction R rarr P the variation in the concentration (R ) vs .Time (t) plot given as (i) predict the order of the reaction (ii) what is he slope of the curve?
View SolutionConsider the reaction, A overset(k) (to) B . The change in concentration with time t is shown in the graph below Find the slope of the curve.
View SolutionWhen plotted a graph of concentration → Time for zero order reaction, then the value of Slope is
View Solution
