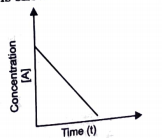
Consider the reaction Ak−−→P. The change in concentration of A with time is shown in the following plot:

Predict the order of the reaction .Solution in Punjabi
Step by step video & image solution for Consider the reaction A overset (k) rarr P. The change in concentration of A with time is shown in the following plot: Predict the order of the reaction . by Chemistry experts to help you in doubts & scoring excellent marks in Class 12 exams.
Updated on:21/07/2023Topper's Solved these Questions
- CHEMICAL KINETICSBOOK - MODERN PUBLICATIONCHAPTER - CHEMICAL KINETICSEXERCISE - EXERCISE
531 Videos
- BIOMOLECULESBOOK - MODERN PUBLICATIONCHAPTER - BIOMOLECULESEXERCISE - EXERCISE
503 Videos
- CHEMISTRY IN EVERYDAY LIFEBOOK - MODERN PUBLICATIONCHAPTER - CHEMISTRY IN EVERYDAY LIFEEXERCISE - EXERCISE
352 Videos
Similar Questions
How can we express the rates of following reactions in terms of concentration of reactants and products ?
2O3↔3O2
View SolutionComplete the following statement- Uses for solder are-
View SolutionTrue or False : Equanil, used as tranquilizer, is a derivative of barbituric acid.
View SolutionFor the two step reaction in which both the steps are first order R overset(k_(1))rarr I I overset(k_(2))rarr P the rate of change of concentration of I is given by the plot
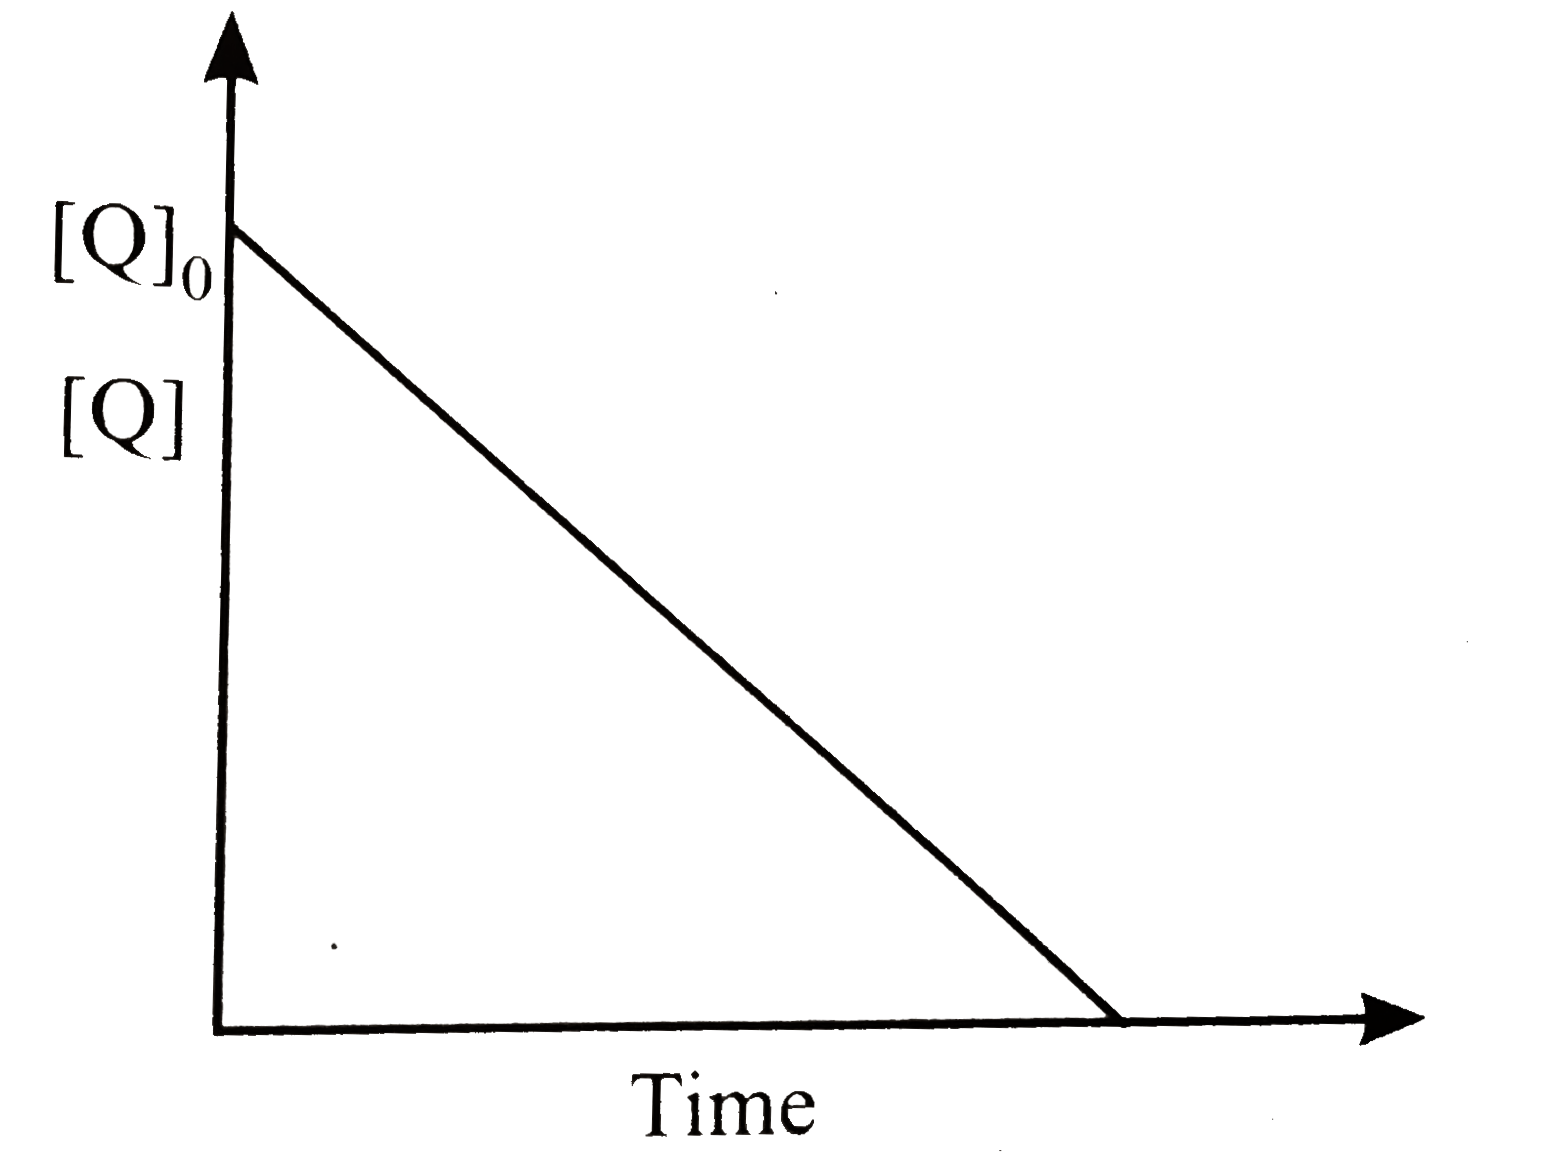
View SolutionConsider the reaction AtoP . The change in concentration of A with time has been shown graphically. i) Predict the order of the reaction. ii) Derive an expression for the time required for the completion of the reaction.
View SolutionFor a chemical reactin R → P, variation of concentration of R vs time plot is given below : For this reaction :
(i) Predict the order of reaction.
(ii) What is the unit of rate constant (k) ?
View SolutionFor a chemical reaction R to P, the variation in the concentration (R) vs time (t) plot is given : Predict the order of reaction.
View SolutionIn the reaction P→Q if the concentration of P is increased by four times the rate of reaction is increased by two times . The order of reaction is :
View SolutionFor a chemical reactin R → P, variation of concentration of R vs time plot is given below : For this reaction :
(i) Predict the order of reaction.
(ii) What is the unit of rate constant (k) ?
View SolutionIn the reaction, P+Q→R+S
the time taken for 75% reaction of P is twice the time taken for 50% reaction of P. The concentration of Q varies with reaction time as shown in the figure. The overall order of the reaction is

View SolutionConsider the reaction, A overset(k) (to) B . The change in concentration with time t is shown in the graph below Predict the order of the reaction.
View SolutionConsider the reaction, Ak−−→B. The change in concentration with time t is shown in the graph below

Derive the expression for the time which is required to complete the reaction.
View SolutionConsider the reaction, A overset(k) (to) B . The change in concentration with time t is shown in the graph below Find the slope of the curve.
View SolutionIn the reaction, P + Q rarr R + S, the time taken for 75% reaction of P is twice the time taken for 50% reaction of P. The concentration of Q varies with reaction time as shown in figure. The overall order of the reaction is
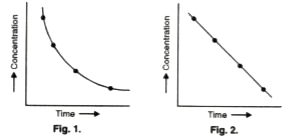
View SolutionIn the reaction A→ B , if the concentration of A is plotted against time, the curves obtained will be as shown in Fig. 1 and 2. Predict the order of the reactions.

View SolutionIn the reaction A→ B , if the concentration of A is plotted against time, the curves obtained will be as shown in Fig. 1 and 2. Predict the order of the reactions.

View Solution
