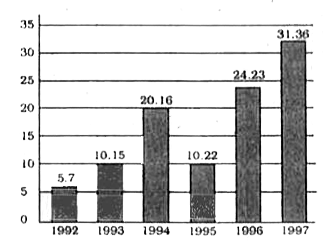
बार ग्राफ में समस्त विश्व से भारत में विदेशी प्रत्यक्ष निवेश (एफ डी आई ) की प्रवृत्ति को दर्शाया गया है।

वर्ष 1996 और 1997 के बीच भारत में किए गए विदेशी प्रत्यक्ष निवेश में सम्पूर्ण अन्तर कितना है ?
7.29 करोड़ रुपए
7.13 करोड़ रुपए
7.16 करोड़ रुपए
7.22 करोड़ रुपए
The correct Answer is:B
Step by step video & image solution for बार ग्राफ में समस्त विश्व से भारत में विदेशी प्रत्यक्ष निवेश (एफ डी आई ) की प्रवृत्ति को दर्शाया गया है। वर्ष 1996 और 1997 के बीच भारत में किए गए विदेशी प्रत्यक्ष निवेश में सम्पूर्ण अन्तर कितना है ? by Maths experts to help you in doubts & scoring excellent marks in Class 14 exams.
Similar Questions
निम्नलिखित में से कौन-सी संख्या 45 और 95 के बीच में नहीं है :
02:45View Solutionनिम्नलिखित में से विदेशी शब्द नहीं है
01:32View Solutionनिम्नांकित में विदेशी शब्द है
00:54View SolutionA book has been co-authored by X and Y. the prices of the book in India and abroad are ₹800 and ₹1000 respectively. The royalties earned on sale in India and abroad are 10% and 16% respectively. the royalty amount is distributed among X and Y in the ratio 5:3. The given bar graph presents the number of copies of the book sold in India (A) and abroad (B) during 2012-16.
एक पुस्तक का सह-लेखन X और Yद्वारा किया गया है| भारत में और विदेश में पुस्तक का मूल्य क्रमशः ₹800 और ₹1000 है| भारत और विदेश में बिक्री पर अर्जित स्वत्व शुल्क (रॉयल्टी] क्रमशः 10% और 16% है| स्वत्व शुल्क[ रॉयल्टी] की धनराशि को X और Y के बीच 5:3 के अनुपात में वितरित किया जाता है| दिया गया स्तम्भ आलेख (बार ग्राफ] 2012-16 के दौरान भारत (A) और विदेश (B) में बिक्री पुस्तक की संख्या को दर्शाता है|
What is the difference between the royalties earned by X and Y (in ₹) during the years 2014 and 2015 taken together?
वर्ष 2014 और 2015 को मिलाकर X तथा Y द्वारा अर्जित स्वत्व शुल्क (रॉयल्टी) में कितना अंतर (₹ में) है?06:07View SolutionWhich Indian film has been selected as India's official entry in the best foreign language film category at Oscars 2018?
किस भारतीय फिल्म को ऑस्कर 2018 में सर्वश्रेष्ठ विदेशी भाषा श्रेणी में भारत के आधिकारिक प्रवेश के रूप में चुन गया है?View SolutionStudy the Bar diagram carefully and answer the question. The Bar diagram shows the trends of foreign direct investment (FDI) into India from all over the World Gin Rs. crores) The sum of FDI of 1992 and 1993 is बार ग्राफ में समस्त विश्व से भारत में विदेशी प्रत्यक्ष निवेश (एफ डी आई) की प्रवृत्ति को दर्शाया गया है। बार ग्राफ का ध्यानपूर्वक अध्ययन कीजिए और प्रश्नों का उत्तर दीजिए। वर्ष 1992 और 1999 में विदेशी प्रत्यक्ष निवेश का कुल योग कितना है ?
01:57View SolutionStudy the Bar diagram carefully and answer the question. The Bar diagram shows the trends of foreign direct investment (FDI) into India from all over the World Gin Rs. crores) The year which exhibited the 2nd highest growth percentage in FDI in India over the period shown is बार ग्राफ में समस्त विश्व से भारत में विदेशी प्रत्यक्ष निवेश (एफ डी आई) की प्रवृत्ति को दर्शाया गया है। बार ग्राफ का ध्यानपूर्वक अध्ययन कीजिए और प्रश्नों का उत्तर दीजिए। दर्शायी गयी अवधि में भारत में किस वर्ष सर्वाधिक विदेशी प्रत्यक्ष निवेश किया गया ?
01:35View SolutionStudy the Bar diagram carefully and answer the question. The Bar diagram shows the trends of foreign direct investment (FDI) into India from all over the World Gin Rs. crores) The ratio of investment in 1997 to the average investment बार ग्राफ में समस्त विश्व से भारत में विदेशी प्रत्यक्ष निवेश (एफ डी आई) की प्रवृत्ति को दर्शाया गया है। बार ग्राफ का ध्यानपूर्वक अध्ययन कीजिए और प्रश्नों का उत्तर दीजिए। वर्ष 1992 और 1997 में किए गए निवेश का अनुपात क्या है।
02:28View Solution

