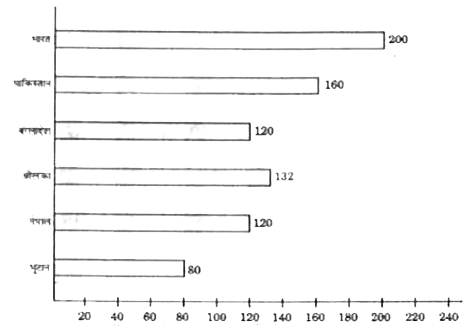
नीचे दिए गए बार ग्राफ में अलग -अलग देशों की प्रति एकड़ उपज (किग्रा . में ) दर्शाई गई है।

भारत की प्रति एकड़ उपज पाकिस्तान की प्रति एकड़ उपज से कितने प्रतिशत अधिक है ?
20%
25%
3313%
35%
The correct Answer is:B
Step by step video, text & image solution for नीचे दिए गए बार ग्राफ में अलग -अलग देशों की प्रति एकड़ उपज (किग्रा . में ) दर्शाई गई है। भारत की प्रति एकड़ उपज पाकिस्तान की प्रति एकड़ उपज से कितने प्रतिशत अधिक है ? by Maths experts to help you in doubts & scoring excellent marks in Class 14 exams.
Similar Questions
The bar graph provided below represents the production of rice and wheat in different states of a country in the certain year. Answer the questions based on the bar graph. नीचे दिये गया बार-ग्राफ एक निश्चित वर्ष में विभिन्न प्रदेशों में चावल और गेहूँ की उपज को दर्शाता है। इस ग्राफ पर आधारित प्रश्नों के उत्तर दें। The ratio of total production of rice in the mentioned states to that of wheat in those states, is दिये गये प्रदेशों में चावल की कुल उपज का गेहूँ की कुल उपज से अनुपात है-
03:01View SolutionThe bar graph provided below represents the production of rice and wheat in different states of a country in the certain year. Answer the questions based on the bar graph. नीचे दिये गया बार-ग्राफ एक निश्चित वर्ष में विभिन्न प्रदेशों में चावल और गेहूँ की उपज को दर्शाता है। इस ग्राफ पर आधारित प्रश्नों के उत्तर दें। The difference between the production in rice and wheat is maximum in- चावल की उपज और गेहूँ की उपज में अधि कतम अंतर है-
01:25View SolutionThe bar graph provided below represents the production of rice and wheat in different states of a country in the certain year. Answer the questions based on the bar graph. नीचे दिये गया बार-ग्राफ एक निश्चित वर्ष में विभिन्न प्रदेशों में चावल और गेहूँ की उपज को दर्शाता है। इस ग्राफ पर आधारित प्रश्नों के उत्तर दें। The average of production of rice in the mentioned states (in lakh tonnes) is दिये गये प्रदेशों में चावल की उपज का औसत (लाख टनों में) है-
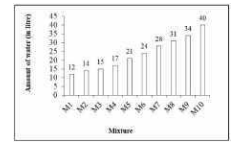
02:11View SolutionThe Bar graph below presents the amount (volume in litres) of water in ten different mixtures.
यह दंड आरेख दस अलग-अलग मिश्रणों में पानी की मात्रा ( लीटर में ) को दर्शाता है | The amount of water in mixture
M7 is how much more than the average amount of water per mixture?
मिश्रण M7 में पानी की मात्रा प्रति मिश्रण पानी की औसत मात्रा से कितनी अधिक है ?02:19View Solutionअलग -अलग कोटि की अभिक्रियाओं में तुलना
45:00View SolutionIdentify A,B,C and D,E
02:22View SolutionConsider the following reactions.
05:37View Solutionकितने यौगिकों की इलेक्ट्रॉनरागी प्रतिस्थापन की दर, बेन्जीन की तुलना में अधिक होती है?
 View Solution

