The bar graph provided below represents the production of rice and wheat in different states of a country in the certain year. Answer the questions based on the bar graph.
नीचे दिये गया बार-ग्राफ एक निश्चित वर्ष में विभिन्न प्रदेशों में चावल और गेहूँ की उपज को दर्शाता है। इस ग्राफ पर आधारित प्रश्नों के उत्तर दें।
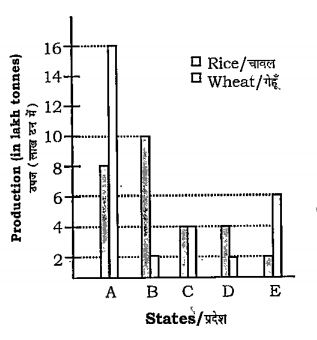 The average of production of rice in the mentioned states (in lakh tonnes) is
दिये गये प्रदेशों में चावल की उपज का औसत (लाख टनों में) है-
5.5
5.6
5.7
5.8
Step by step video & image solution for The bar graph provided below represents the production of rice and wheat in different states of a country in the certain year. Answer the questions based on the bar graph. नीचे दिये गया बार-ग्राफ एक निश्चित वर्ष में विभिन्न प्रदेशों में चावल और गेहूँ की उपज को दर्शाता है। इस ग्राफ पर आधारित प्रश्नों के उत्तर दें। The average of production of rice in the mentioned states (in lakh tonnes) is दिये गये प्रदेशों में चावल की उपज का औसत (लाख टनों में) है- by Maths experts to help you in doubts & scoring excellent marks in Class 14 exams.
Updated on:21/07/2023Topper's Solved these Questions
Similar Questions
The bar graph provided below represents the production of rice and wheat in different states of a country in the certain year. Answer the questions based on the bar graph.
नीचे दिये गया बार-ग्राफ एक निश्चित वर्ष में विभिन्न प्रदेशों में चावल और गेहूँ की उपज को दर्शाता है। इस ग्राफ पर आधारित प्रश्नों के उत्तर दें।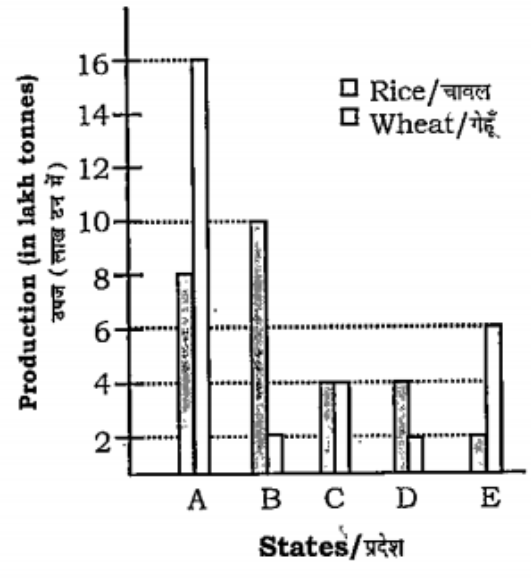 The ratio of total production of rice in the mentioned states to that of wheat in those states, is
दिये गये प्रदेशों में चावल की कुल उपज का गेहूँ की कुल उपज से अनुपात है-
View SolutionThe bar graph provided below represents the production of rice and wheat in different states of a country in the certain year. Answer the questions based on the bar graph.
नीचे दिये गया बार-ग्राफ एक निश्चित वर्ष में विभिन्न प्रदेशों में चावल और गेहूँ की उपज को दर्शाता है। इस ग्राफ पर आधारित प्रश्नों के उत्तर दें।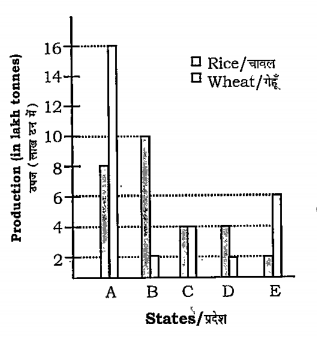 The total production of rice and wheat in all the mentioned states in minimum in the state.
दिये गये सभी प्रदेशों में से किस प्रदेश में चावल व गेहूँ को कुल उपज सबसे कम है?
View Solution
Knowledge Check
The bar graph given below shows the production (in000 tonnes) of rice of a country for the year 2007 to 2011 .
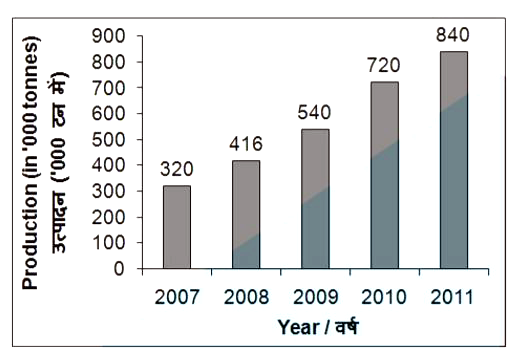
What is the average production of rice per year from 2009 to 2011 ?A700B550C860D900The bar graph given below shows the production (in000 tonnes) of rice of a country for the year 2007 to 2011 .
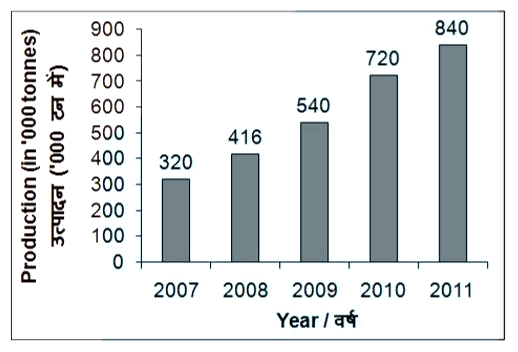
the production of rice in year 2011 is what percent of the production of rice in 2010 ?A116.66B121.5C133.33D108.5The bar graph given below shows the production (in 000 tonnes) of rice of a country for the year 2007 to 2011 ?
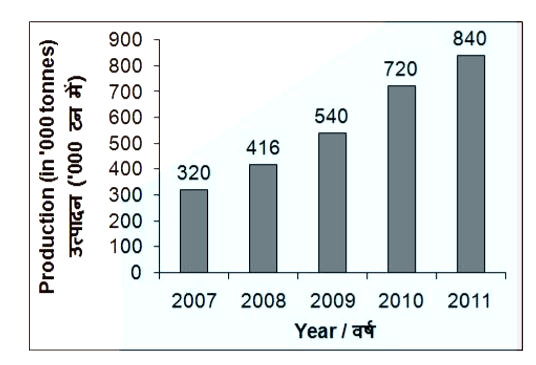
How much is the percentage increase in the production of rice in the year 2008 in comparison to year 2007 ?A25B30C35D40
The bar graph provided below represents the production of rice and wheat in different states of a country in the certain year. Answer the questions based on the bar graph.
नीचे दिये गया बार-ग्राफ एक निश्चित वर्ष में विभिन्न प्रदेशों में चावल और गेहूँ की उपज को दर्शाता है। इस ग्राफ पर आधारित प्रश्नों के उत्तर दें।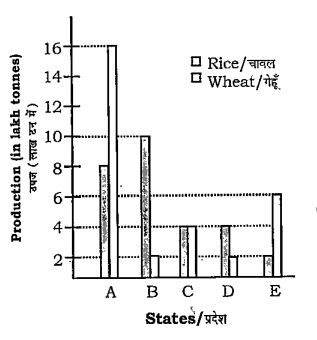 The difference between the production in rice and wheat is maximum in-
चावल की उपज और गेहूँ की उपज में अधि कतम अंतर है-
View SolutionThe pie-chart provided below gives the distribution of land (in a village) under various food crops. Study the pie-chart carefully and answer the questions.
नीचे दिए गए वृत्तारेखा में विभिन खाद्य फसलों के ( एक गाँव में ) भूमि का वितरण दिखाया गया हैं। वृत्तारेखा का अध्ययन कीजिए और प्रश्नों के उत्तर दीजिए।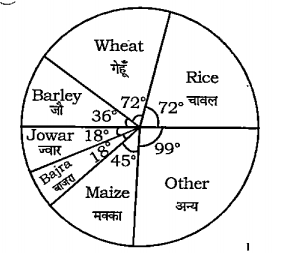 The ratio of the land used for rice and barley is
चावल और जौ के उत्पादन के लिए प्रयुक्त भूमि का अनुपात है-
View SolutionStudy the following graph which shows the production (in thousand) of different items, and answer the questions.
निम्नलिखित ग्राफ का अध्ययन कीजिए, जिन विभिन्न मदों का उत्पादन (हजार में) दर्शाया गया है तथा दिए गए प्रश्नों के उत्तर दीजिए।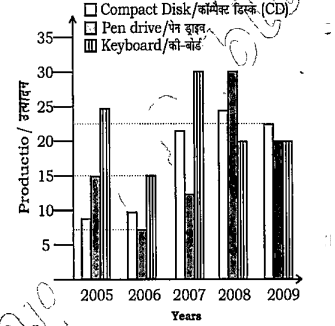 The total number of all products produced by the company in the year 2006 and 2008 together is:-
कंपनी द्वारा वर्ष 2006 और 2008 में तेयार सभी उत्पादों को मिलाकर उनकी कुल संख्या कितनी है?
View SolutionStudy the graph and answer the question
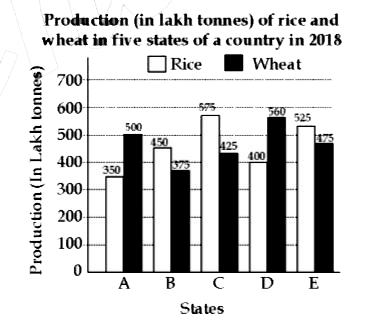
the ratio of the total production of rice in states C and E to the total production of wheat in states B and D is……..
View SolutionThe following graph shows the sales of cars (in thousands) in four cities in 4 years. Study the graph and answer the questions.
निम्नलिखित आरेख 4 वर्षों में चार शहरों में कारों की बिक्री (हज़ार में) को दर्शाता है। इस आरेख का अध्ययन कीजिए तथा प्रश्नों के उत्तर दीजिए। In which year, the sales are highest?
किस वर्ष, बिक्री सबसे अधिक हुई है?
View Solution
