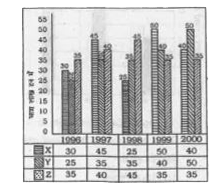
निम्नलिखित बार ग्राफ में तीन भिन्न-भिन्न कंपनियों X, Y एवं Z द्वारा कुछ वर्षो में किए गए कागज के उत्पादन (लाख टन में) आकड़ों को दर्शया गया है। बार ग्राफ का अध्ययन कीजिए

पांच वर्षों का औसत उत्पादन किस कंपनी का अधिकतम है ?
X और Z
X
Z
Y
The correct Answer is:A
Step by step video & image solution for निम्नलिखित बार ग्राफ में तीन भिन्न-भिन्न कंपनियों X, Y एवं Z द्वारा कुछ वर्षो में किए गए कागज के उत्पादन (लाख टन में) आकड़ों को दर्शया गया है। बार ग्राफ का अध्ययन कीजिए पांच वर्षों का औसत उत्पादन किस कंपनी का अधिकतम है ? by Maths experts to help you in doubts & scoring excellent marks in Class 14 exams.
Updated on:21/07/2023Similar Questions
The average Kharif production of the given years is- दिए गए वर्षों में खरीफ का फसलों का औसत उत्पादन कितना है?
View SolutionThe table shows the production of different types of cars (in thousands). यह तालिका एक कंपनी द्वारा अलग-अलग कारों के उत्पादन (हज़ार में ) को दर्शाती है | The average production of type A cars during the five years is what percent of the total production of type C cars during the five years? पांच वर्षों के दौरान A प्रकार की कारों का औसत उत्पादन पांच वर्षों के दौरान C प्रकार की कारों के कुल उत्पादन का कितना प्रतिशत है ?
View SolutionThe given Bar graph presents the Demand and Production of motorcycles of five companies (in lakhs) दिया गया दंड आरेख पांच कंपनियों के संबंध में मोटरसाइकिलों की मांग और उत्पादन ( लाख में ) को दर्शाता है| What is the ratio of the total Demand of motorcycles of companies A and D taken together to the Production of motorcycles of company C? कंपनी A और D को मिलाकर मोटरसाइकिलों की कुल मांग का कंपनी C की मोटरसाइकिलों के उत्पादन के साथ अनुपात ज्ञात करें |
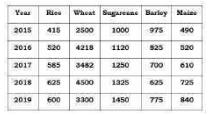
View SolutionIn the following table, the production of various crops (in tonnes) is given from 2015 to 2019. Study the table and answer the question that follows:
दी गयी तालिका में, 2015 से 2019 तक विभिन्न फसलों का उत्पादन (टन में ) दिया गया है | इस तालिका का अध्ययन करें तथा फिर पूछे गए प्रश्न का उत्तर दीजिए | The difference (in tonnes) between the average production of barley and average production of rice is:
जौ के औसत उत्पादन तथा चावल के औसत उत्पादन के बीच क्या अंतर (टन में ) है?
View SolutionThe following bar graph shows the data of the production of an item (in thousand tonnes) from four different companies A, B, C and D during the year mentioned.
निम्नलिखित दंड आरेख में उल्लिखित वर्षों के दौरान चार अलग-अलग कंपनियों A, B, C और D के द्वारा एक वस्तु (हजार टन में) के उत्पादन का आंकड़ा दिखाया गया है। In the five years given, the average production is highest in company _______ and lowest in company _______, respectively.
दिए गए पांच वर्षों में, औसत उत्पादन कंपनी______में सबसे अधिक है और कंपनी________ में सबसे कम है।
View SolutionThe given Bar Graph presents the Demand and Production of motorcycles of five companies (in lakhs). The Company in which the Production of motorcycles is approximately 23% more than the Demand is: दिया गया दंड आरेख (बार ग्राफ) पांच कंपनियों द्वारा मोटरसाइकिलों की मांग और उत्पादन को (लाखों में) दर्शाता है| वह कंपनी कौन सी है, जिसमें मोटरसाइकिलों का उत्पादन उनकी मांग से लगभग 23% अधिक है:
View SolutionThe given Bar Graph present the Imports and Exports of an item (in tonnes) manufactured by a company for the five financial years, 2013-2014 to 2017-2018. दिया गया दंड आरेख (बार ग्राफ) पांच वित्त वर्षों, 2013-2014 से 2017-2018, के दौरान किसी कंपनी दवारा निर्यात किसी वस्तु (टन में] के आयात और निर्यात को दर्शाता है| What is the average of total Import and Export (in tonnes) during five financial years? पांच वित्त वर्षो के दौरान कुल आयात और निर्यात (टन में) का औसत क्या है?
View SolutionStudy the following graph which shows income and expenditure of a company over the years and answer the questions. In how many years was the expenditure of the company more than the average expenditure of the given years? निम्नलिखित चार्ट का अध्ययन कीजिए जिसमें कंपनी की कुछ वर्षों की आय एवं उसके व्यय को दर्शाया गया है और प्रश्नों के उत्तर दीजिए : कितने वर्षों में कंपनी का व्यय दिए गए वर्षों के औसत व्यय से अधिक था?
View Solution
