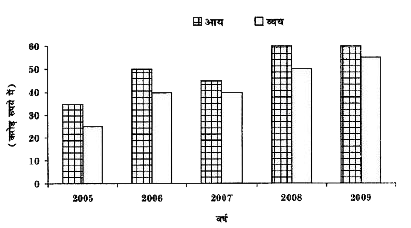
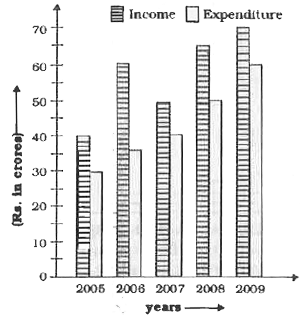
Study the following graph which shows income and expenditure of a company over the years and answer the questions.
In how many years was the expenditure of the company more than the average expenditure of the given years?
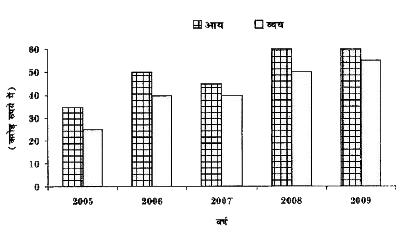
निम्नलिखित चार्ट का अध्ययन कीजिए जिसमें कंपनी की कुछ वर्षों की आय एवं उसके व्यय को दर्शाया गया है और प्रश्नों के उत्तर दीजिए :
कितने वर्षों में कंपनी का व्यय दिए गए वर्षों के औसत व्यय से अधिक था?
4
3
2
1
The correct Answer is:C
औसत व्यय = (25+40+ 40+50+55)/5 = 210/5 = ₹ 42 करोड़
ग्राफ से स्पष्ट है कि सिर्फ वर्ष 2008 तथा वर्ष 2009 में व्यय औसत व्यय से अधिक रहा।
Similar Questions
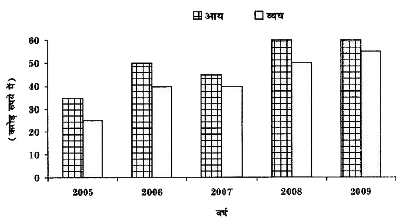
Study the following graph which shows income and expenditure of a company over the years and answer the questions.
Ratio of total income to total expenditure of the company over the years is.
निम्नलिखित चार्ट का अध्ययन कीजिए जिसमें कंपनी की कुछ वर्षों की आय एवं उसके व्यय को दर्शाया गया है और प्रश्नों के उत्तर दीजिए :
दिए गए वर्षों में कंपनी की कुल आय और कुल व्यय का अनुपात क्या रहा?
View SolutionStudy the following graph which shows income and expenditure of a company over the years and answer the questions.
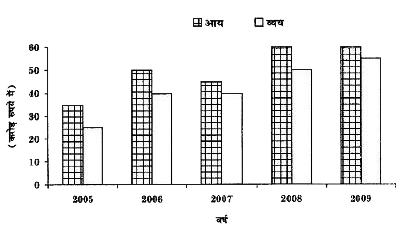
The percentage increase in income of the company from 2007 to 2008 is.
निम्नलिखित चार्ट का अध्ययन कीजिए जिसमें कंपनी की कुछ वर्षों की आय एवं उसके व्यय को दर्शाया गया है और प्रश्नों के उत्तर दीजिए :
वर्ष 2007 से 2008 तक कंपनी की आय में वृद्धि का प्रतिशत कितना रहा?
View Solution
Knowledge Check
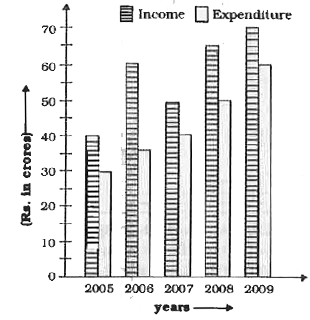
Study the following graph which shows income and expenditure of a company over the years 2005 - 2009 and answer the questions.
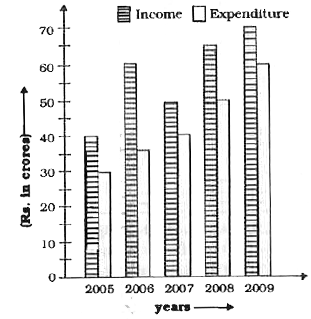
In how many years was the income of the company less than the average income of the given years ?A4B3C2D1Study the following graph which shows income and expenditure of a company over the years 2005 - 2009 and answer the questions.
Profit of the company was maximum in the yearA2009B2008C2006D2005Study the following graph which shows income and expenditure of a company over the years 2005 - 2009 and answer the questions.
The percentage increase in expenditure of the company from 2007 to 2008 isA20B25C30D35
Study the following graph which shows income and expenditure of a company over the years and answer the questions.
The difference in profit (in crores) of the company during 2007 and 2008 is.
निम्नलिखित चार्ट का अध्ययन कीजिए जिसमें कंपनी की कुछ वर्षों की आय एवं उसके व्यय को दर्शाया गया है और प्रश्नों के उत्तर दीजिए :
वर्ष 2007 और 2008 में कंपनी के लाभ में अंतर (₹ करोड़ में) कितना है?
View SolutionStudy the given graph and answer the question that follows
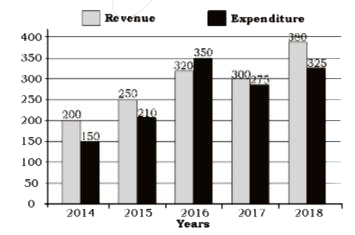
In how many years was the revenue of the company more than 1.2 times the average expenditure over the given five years?
View SolutionThe graph shows Income and Expenditure of a company. Study the graph and answer the questions.
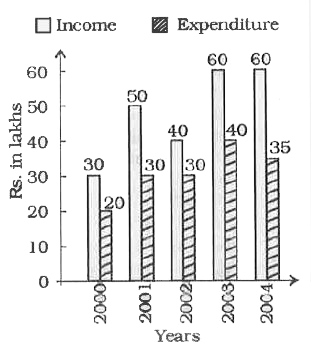
The income in 2002 was equal to the expenditure in the year
View SolutionThe graph shows Income and Expenditure of a company. Study the graph and answer the questions.
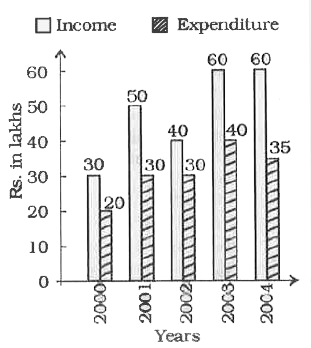
The profit was maximum in the year
View SolutionStudy the following graph which shows income and expenditure of a company over the years 2005 - 2009 and answer the questions.
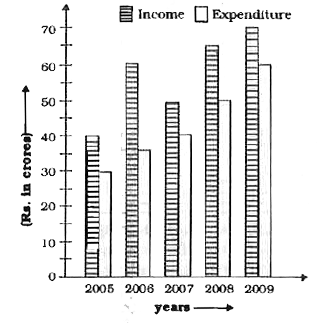
The differnce in profit (Rs. In crores) of the company during 2006 and 2007 is
View Solution
