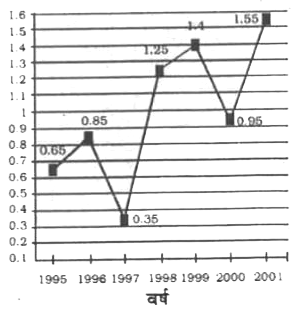
निम्नलिखित रेखीय ग्राफ 1995 से 2001 की अवधि में किसी कंपनी द्वारा आयात की मात्रा से उस कंपनी के निर्यात की मात्रा का अनुपात दर्शाता है।

यदि 1995 में कम्पनी का आयात 247 करोड़ रुपये था, तो 1995 में कम्पनी द्वारा निर्यात कितना था ?
275 करोड़ रुपये
280 करोड़ रुपये
370 करोड़ रुपये
380 करोड़ रुपये
The correct Answer is:D
Step by step video & image solution for निम्नलिखित रेखीय ग्राफ 1995 से 2001 की अवधि में किसी कंपनी द्वारा आयात की मात्रा से उस कंपनी के निर्यात की मात्रा का अनुपात दर्शाता है। यदि 1995 में कम्पनी का आयात 247 करोड़ रुपये था, तो 1995 में कम्पनी द्वारा निर्यात कितना था ? by Maths experts to help you in doubts & scoring excellent marks in Class 14 exams.
Updated on:21/07/2023Similar Questions
The given Bar Graph presents the Imports and Exports of an item (in tonnes) manufactured by a company for the five financial years, 2013-2014 to 2017-2018. दिया गया दंड आरेख (बार ग्राफ) 5 वित्त वर्षों, 2013-2014 से 2011-2018 के दौरान एक कंपनी द्वारा निर्मित किसी वस्तु (टन में) के आयात और निर्यात को दर्शाता है | What is the ratio of total Imports to total Exports during the five financial years? पांचों वित्त वर्षों के दौरान कुल आयात और कुल निर्यात का अनुपात क्या है?
View SolutionThe given Bar Graph present the Imports and Exports of an item (in tonnes) manufactured by a company for the five financial years, 2013-2014 to 2017-2018. दिया गया दंड आरेख (बार ग्राफ) पांच वित्त वर्षों, 2013-2014 से 2017-2018, के दौरान किसी कंपनी दवारा निर्यात किसी वस्तु (टन में] के आयात और निर्यात को दर्शाता है| What is the ratio of total Imports to total Exports during 2013-2014, 2015-2016 and 2017-2018? 2013-2014, 2015-2016 3X 2017-2018 के दौरान कुल आयात का कुल निर्यात से क्या अनुपात है?
View SolutionThe given Bar Graph present the Imports and Exports of an item (in tonnes) manufactured by a company for the five financial years, 2013-2014 to 2017-2018. दिया गया दंड आरेख (बार ग्राफ) पांच वित्त वर्षों, 2013-2014 से 2017-2018, के दौरान किसी कंपनी दवारा निर्यात किसी वस्तु (टन में] के आयात और निर्यात को दर्शाता है| What is the average of total Import and Export (in tonnes) during five financial years? पांच वित्त वर्षो के दौरान कुल आयात और निर्यात (टन में) का औसत क्या है?
View SolutionThe given Bar Graph present the Imports and Exports of an item (in tonnes) manufactured by a company for the five financial years, 2013-2014 to 2017-2018. दिया गया दंड आरेख (बार ग्राफ) पांच वित्त वर्षों, 2013-2014 से 2017-2018, के दौरान किसी कंपनी दवारा निर्यात किसी वस्तु (टन में] के आयात और निर्यात को दर्शाता है| In which financial year the total of Exports and Imports is the lowest? किस वित्त वर्ष में निर्यात और आयात का कुल जोड़ सबसे कम है?
View SolutionThe given Bar Graph present the Imports and Exports of an item (in tonnes) manufactured by a company for the five financial years, 2013-2014 to 2017-2018. दिया गया दंड आरेख (बार ग्राफ) पांच वित्त वर्षों, 2013-2014 से 2017-2018, के दौरान किसी कंपनी दवारा निर्यात किसी वस्तु (टन में] के आयात और निर्यात को दर्शाता है| What is the ratio of total Imports to total Exports during 2014- 2015, 2015- 2016 and 2016- 2017? वर्ष 2014-2015, 2015-2016 33 2016-2011 के दौरान, कुल आयात और निर्यातों का अनुपात कितना है?
View SolutionStudy the following graph and answer the given questions: निम्न ग्राफ का अध्ययन कीजिए और दिये गये प्रश्नों के उत्तर दीजिए: If the rate of one barrel of crude oil was Rs. 25.60 in 1995, then what was the total value of imports in ) in that year? यदि वर्ष 1995 में क्रूड ऑयल के एक बैरल की दर Rs. 25.60 थी, तो उस वर्ष आयात का कुल मूल्य (Rs. में) कितना था?
View Solutionध्रुवण का अर्थ होता है, "एक निकटतम स्थित धनायन द्वारा ऋणायन की आकृति में विकृति"। ध्रुवण के बारे में निम्नलिखित में से कौन सा कथन सही है?
View Solutionनिम्नलिखित में से किस लवण के जल-अपघटन की मात्रा लवण के विलयन की सांद्रता पर निर्भर नहीं करती है?
View Solution
