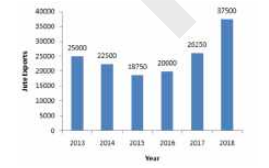
The following bar graph shows the quantity (in million) of grains exported by a country for a period. The maximum export is what percent more than the minimum export in the given period ?
निम्नलिखित दंड आरेख के दौरान किसी देश द्वारा निर्यात किए गए अनाज की मात्रा (मिलियन में) दर्शाता है | दी गई अवधि में अधिकतम निर्यात न्यूनतम निर्यात से कितना प्रतिशत अधिक है ?
1
0.5
0.75
0.6667
Step by step video & image solution for The following bar graph shows the quantity (in million) of grains exported by a country for a period. The maximum export is what percent more than the minimum export in the given period ? निम्नलिखित दंड आरेख के दौरान किसी देश द्वारा निर्यात किए गए अनाज की मात्रा (मिलियन में) दर्शाता है | दी गई अवधि में अधिकतम निर्यात न्यूनतम निर्यात से कितना प्रतिशत अधिक है ? by Maths experts to help you in doubts & scoring excellent marks in Class 14 exams.
Updated on:21/07/2023Topper's Solved these Questions
Similar Questions
The following bar graph shows the amount of imports (in million kg) of a particular item imported by India during 2014-2018. The amount of import of the said item is how many years less than the time average of imports ?
निम्नलिखित दंड आरेख में भारत द्वारा 2014-2018 के दौरान आयात की गई किसी विशेष मद के आयातों की मात्रा (मिलियन kg में) दर्शाया गयी है| दी गई अवधि के दौरान उक्त मद की आयात की गई मात्रा, आयातों की समय औसत से कितने वर्ष कम है ?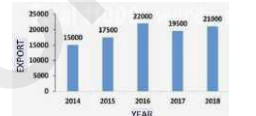
View SolutionThe given Bar Graph presents the number of different types of vehicles exported by a company in 2017 and 2018.The average export of vehicles in 2018 is what percent more than the export of vehicle A in 2017?
दिया गया दंड आरेख एक कंपनी के द्वारा 2017 और 2018 में निर्यात किये गए अलग-अलग प्रकार के वाहनों की संख्या को दर्शाता है |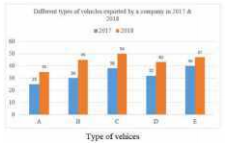
2018 में वाहनों का औसत निर्यात 2017 में वाहन A के निर्यात से कितना प्रतिशत अधिक है ?
View Solution
Knowledge Check
The following bar chart shows the quantity ( in million kg) of grains exported by a country during from 2013-2018. By how much percent is the maximum export greater than the minimum export during the given period?
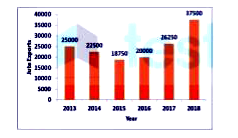 AA) 100%BB) 66.67%CC) 50%DD) 75%
The bar chart shows the annual food grain production (in million tonnes) for years 2012-2017. For how many years is the production less than the average production during the given period?
यह दंड आरेख वर्ष 2012-2017 की अवधि में वार्षिक खाद्यान्न उत्पादन (मिलियन टन में ) को दर्शाता है | कितने वर्ष उत्पादन इस अवधि के औसत उत्पादन से कम है ?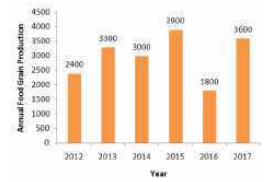
View SolutionThe bar graph given below shows the profit (in multiples of thousand rupees) of a company during the year 2010-2018. The average profit for the year 2015-2017 is what percentage more than the 2012 profit?
नीचे दिए गए दंड आरेख में वर्ष 2010-2018 के दौरान किसी कंपनी के लाभ (हजार रुपए के गुणक में) को दर्शाया गया है | वर्ष 2015-2017 का औसत लाभ 2012 के लाभ से कितना प्रतिशत अधिक है ?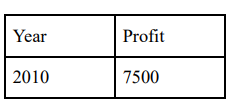
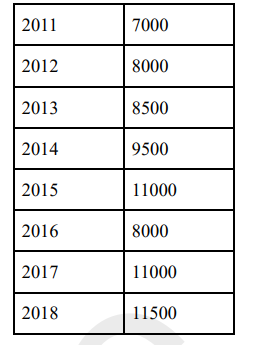
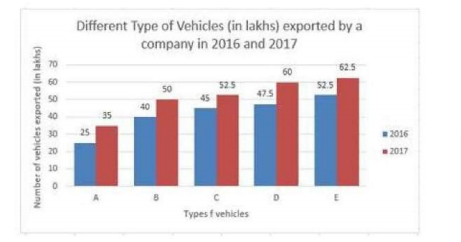
View SolutionThe given Bar Graph presents different types of vehicles (in lakhs) exported by a company in 2016 and 2017. The average number of all types of vehicles exported by the company in 2016 is what percent less than the number of type B vehicles exported in 2017?
View SolutionThe bar graph given below shows the wheat production (in tonnes) of a large farm during the year 2011-2018. In how many years was wheat production higher than the average production of the period?
नीचे दिए गए दंड आरेख में वर्ष 2011-2018 के दौरान किसी बड़े फार्म के गेहूं उत्पादन (टन में) को दर्शाया गया है | अवधि के औसत उत्पादन की तुलना में दिए गए कितने वर्षो में गेहूं उत्पादन अधिक था ?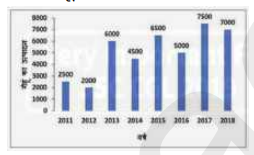
View SolutionObserve the following bar-graph carefully and answer the following questions: The birth rate of Country C is approximately what percentage of the birth rate of Country E?
निम्नलिखित दंड आरेख को ध्यान से देखें और निम्नलिखित प्रश्नों के उत्तर दें: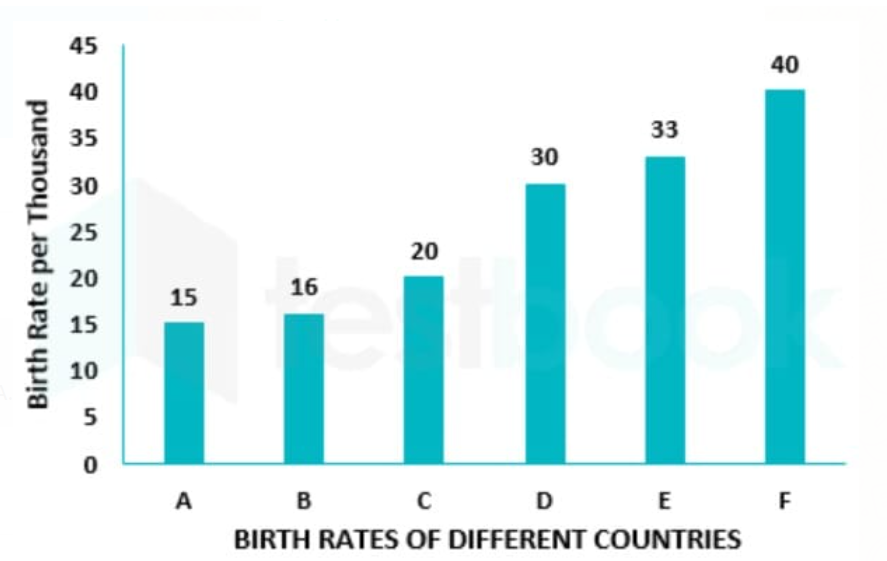
देश C की जन्म दर, देश E की जन्म दर का लगभग कितना प्रतिशत है?
View SolutionThe following pie-chart shows the market share of exporting countries. If the share of a country X is equal to 40% of the share of .other countries. and the volume of exports of the country B is Rs 15 million, then the quantity exported by the country X is:
निम्नलिखित वृत्त आरेख निर्यातक देशों की बाजार हिस्सेदारी को दर्शाता है | यदि देश X की हिस्सेदारी .दूसरे देशों. की हिस्सेदारी के 40% के बराबर है और देश B के निर्यात की मात्रा रु 15 मिलियन है, तो देश द्वारा निर्यात की गई मात्रा है :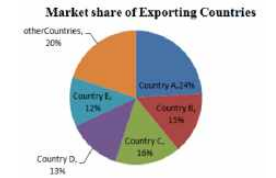
View SolutionThe given Bar Graph presents different types of vehicles (in lakhs) exported by a company in 2016 and 2017. The average number of all types of vehicles exported by the company in 2016 is what percent less than the number of type B vehicles exported in 2017? दिया गया दंड आरेखा (बार ग्राफ) 2016 और 2017 में किसी कंपनी द्वारा निर्यात किए गए विभिन्न प्रकार के वाहनों (लाखों में) को दर्शाता है| 2016 में कंपनी दवारा निर्यात किए गए सभी प्रकार के वाहनों की औसत संख्या, 2017 में निर्यात किए गए टाइप B वाहनों की संख्या से कितने प्रतिशत कम है?

View Solution
