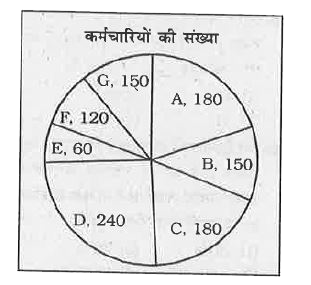
एक कंपनी के मानव संसधान विभाग ने एक रिपोर्ट तैयार की। यह पाई चार्ट कंपनी के सभी कर्मचारियों को और उन राज्यों को दर्शाता है जिनसे वे संबंधित है।

कंपनी के कमर्चारियों की कुल संख्या क्या है ?
1020
960
1080
920
The correct Answer is:C
Step by step video & image solution for एक कंपनी के मानव संसधान विभाग ने एक रिपोर्ट तैयार की। यह पाई चार्ट कंपनी के सभी कर्मचारियों को और उन राज्यों को दर्शाता है जिनसे वे संबंधित है। कंपनी के कमर्चारियों की कुल संख्या क्या है ? by Maths experts to help you in doubts & scoring excellent marks in Class 14 exams.
Updated on:21/07/2023Similar Questions
The given Bar Graph presents Income and Expenditure (in crores of Rupees) of a company for the five years, 2014 to 2018. दिया गया दंड आरेख पांच वर्षों अर्थात 2014 से 2018 तक एक कंपनी के आय एवं व्यय ( करोड़ रुपये में ) को दर्शाता है | What is the ratio of total Expenditure to total Income of the company in 2014, 2016 and 2017? 2014, 2016 और 2017 में कंपनी के कुल व्यय और कुल आय में क्या अनुपात है ?
View SolutionThe given Bar Graph presents Income and Expenditure (in crores of Rupees) of a company for the five years, 2014 to 2018. दिया गया दंड आरेख पांच वर्षों अर्थात 2014 से 2018 तक एक कंपनी के आय एवं व्यय ( करोड़ रुपये में ) को दर्शाता है | What is the ratio of the total revenue of the company in 2015 and 2018 to that of its expenditure in 2014 and 2018? 2015 तथा 2018 में कंपनी की कुल आय और 2014 तथा 2018 में कंपनी के कुल व्यय में क्या अनुपात है ?
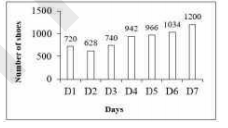
View SolutionThe Bar graph given below presents the number of shoes manufactured by a company on the different days of a week.
नीचे दिया गया दंड आरेख एक कंपनी के द्वारा सप्ताह के अलग-अलग दिनों को बनाए गए जूतों की संख्या प्रस्तुत करता है | The number of shoes manufactured on D1 is what
percentage of shoes manufactured on D7?
D1 को बनाए गए जूतों की संख्या D7 को बनाए गए जूतों की संख्या का कितना प्रतिशत है ?
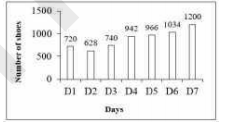
View SolutionThe Bar graph given below presents the number of shoes manufactured by a company on the different days of a week.
नीचे दिया गया दंड आरेख एक कंपनी के द्वारा सप्ताह के अलग-अलग दिनों को बनाए गए जूतों की संख्या प्रस्तुत करता है | What is the total number of shoes manufactured by the company on all seven days together?
सभी सात दिनों को मिलाकर कंपनी के द्वारा बनाए गए जूतों की कुल संख्या कितनी है ?
View SolutionThe given pie chart shows the percentage distribution of 450 employees in an organization. Study the pie chart and answer the questions that follow
दिए गए पाई चार्ट एक संगठन में 450 कर्मचारियों के प्रतिशत को दर्शाता है। पाई चार्ट का अध्ययन करें और आने वाले प्रश्नों का उत्तर दें।
What is the central angle of the sector representing the number of employees in department A?
विभाग A में कर्मचारियों की संख्या का प्रतिनिधित्व करने वाले क्षेत्र का केंद्रीय कोण क्या है?
View SolutionThe given Bar Graph presents Income and Expenditure (in crores of Rupees) of a company for five years, 2014 to 2018. What is the ratio of total Expenditure to total Income of the company in 2014,2016 and 2017? दिया गया दंड आरेख (बार ग्राफ) 5 वर्षों, 2014 से 2018 के दौरान किसी कंपनी की आय और व्यय (करोड़ रुपए में) को दर्शाता है| 2014, 2016 और 2017 में कंपनी के कुल व्यय और कुल आय का अनुपात क्या है?
View SolutionStudy the following graph which shows income and expenditure of a company over the years and answer the questions. Ratio of total income to total expenditure of the company over the years is. निम्नलिखित चार्ट का अध्ययन कीजिए जिसमें कंपनी की कुछ वर्षों की आय एवं उसके व्यय को दर्शाया गया है और प्रश्नों के उत्तर दीजिए : दिए गए वर्षों में कंपनी की कुल आय और कुल व्यय का अनुपात क्या रहा?
View Solutionजल के अणु के विलोपन के साथ ऐल्कोहॉल और एक अम्ल के बीच की अभिक्रिया को कहा जाता है
View Solution
